User Guide
1 Workflow
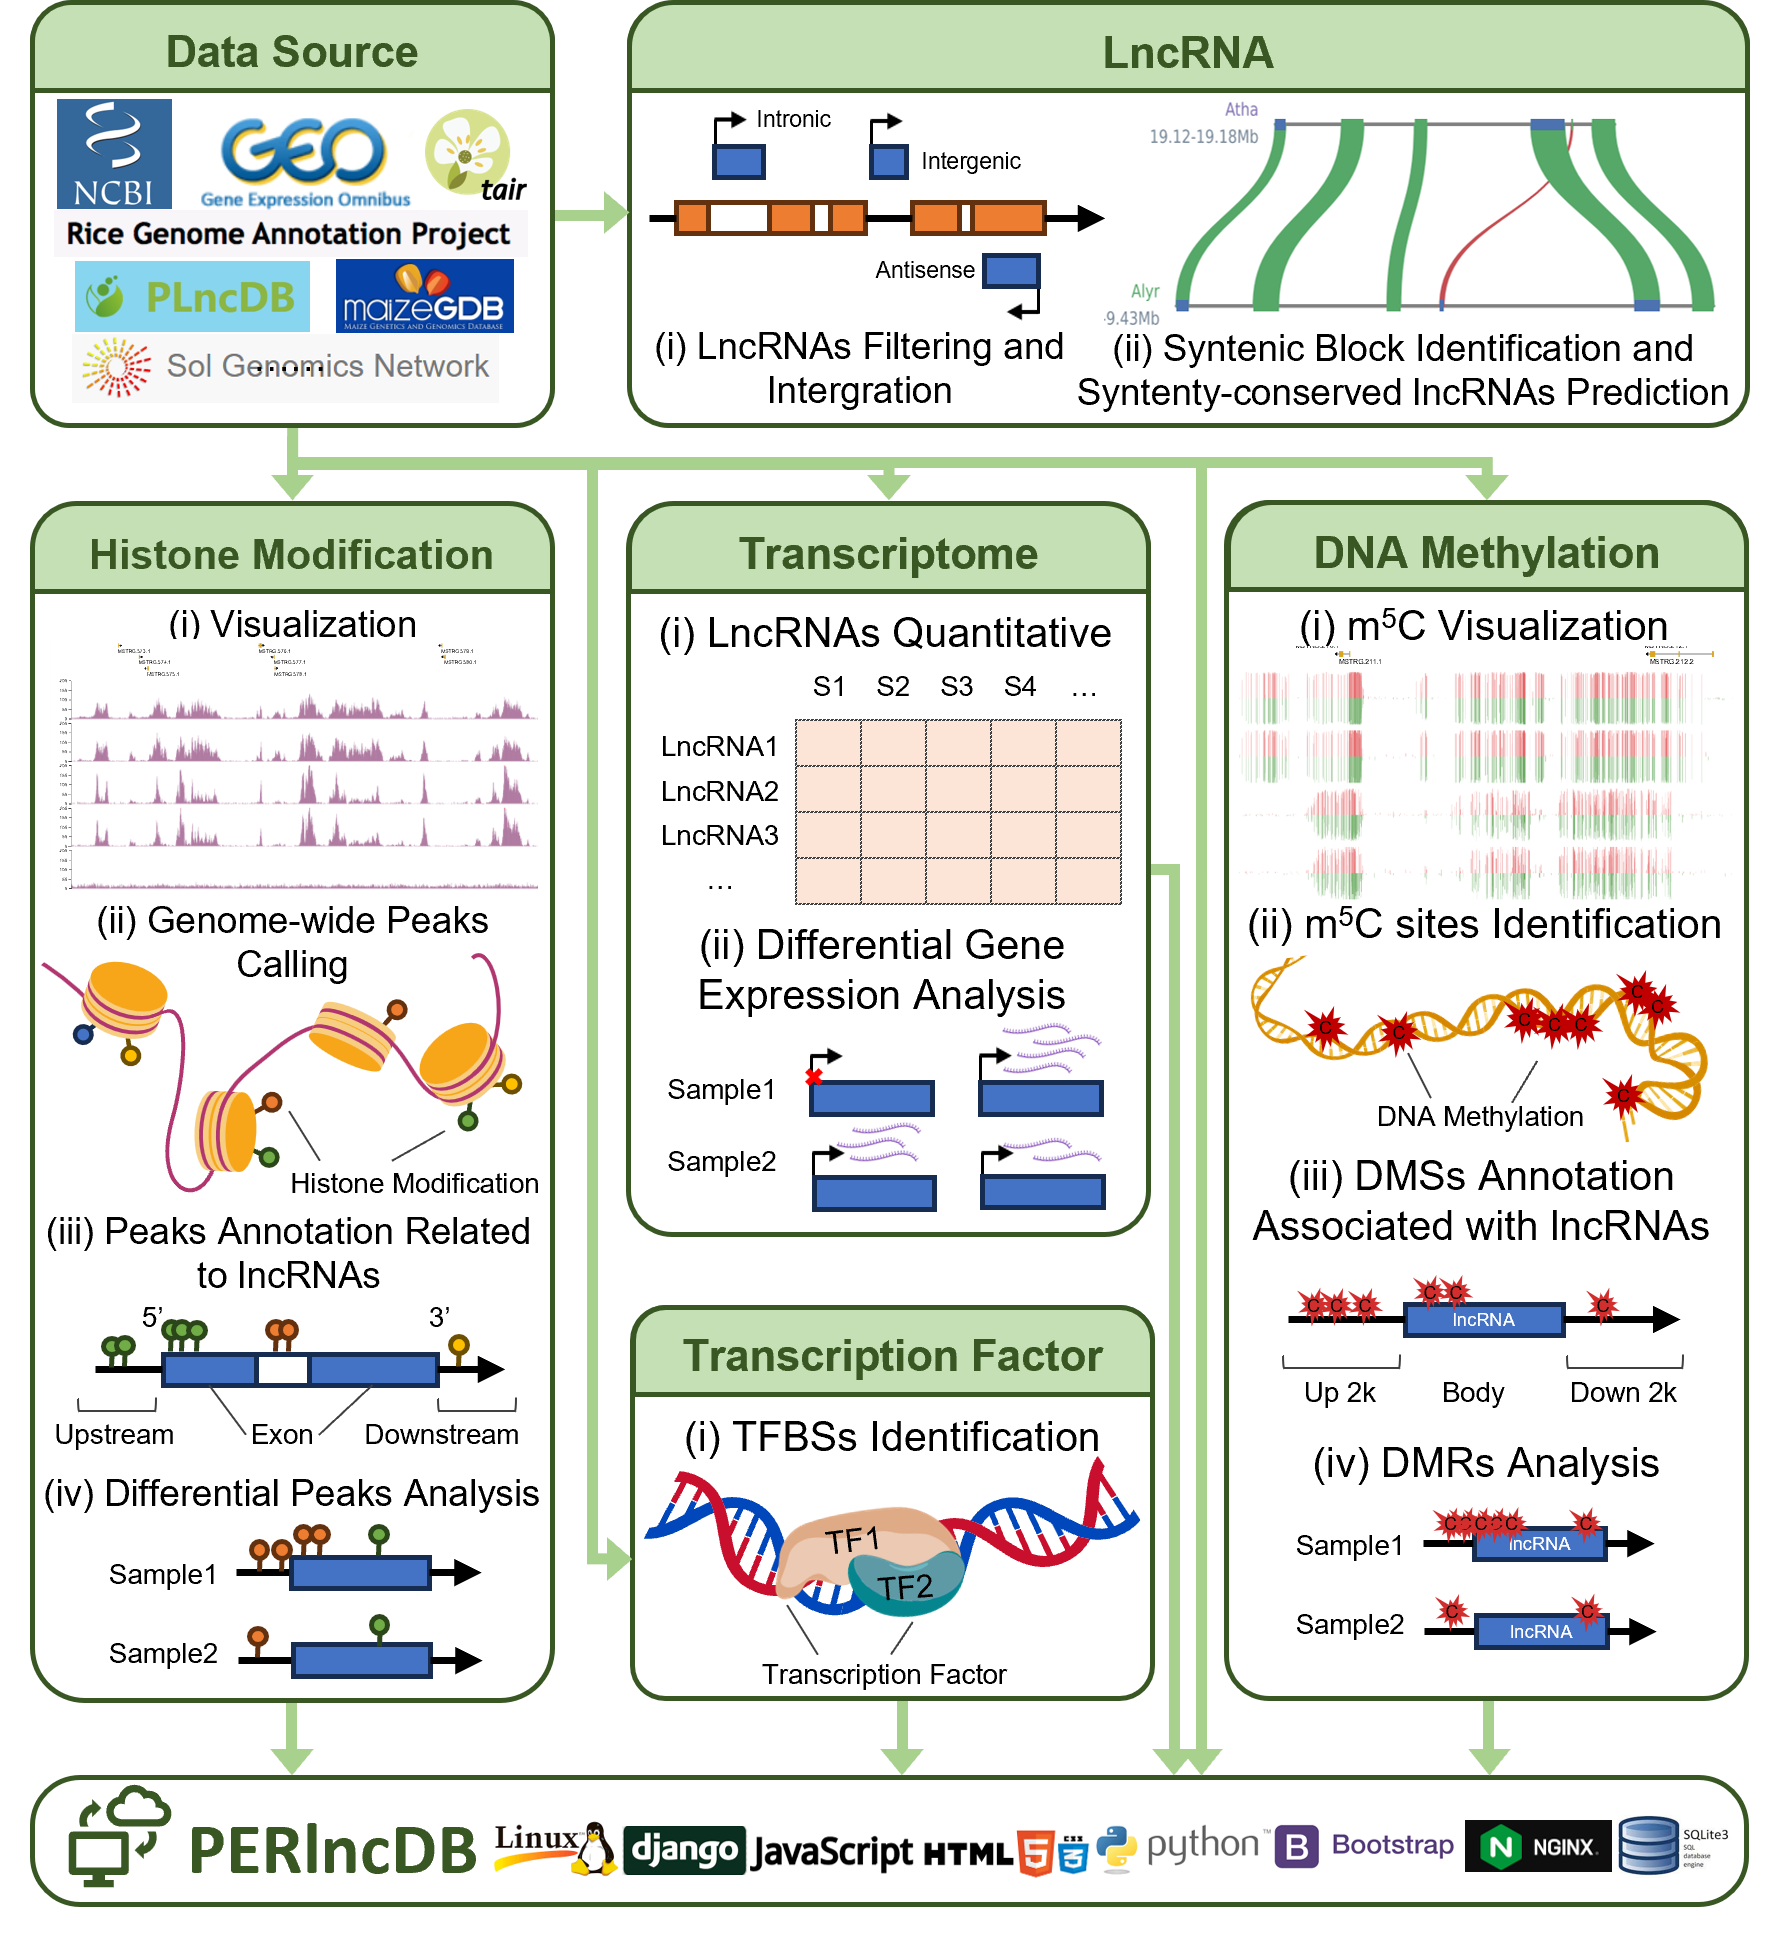
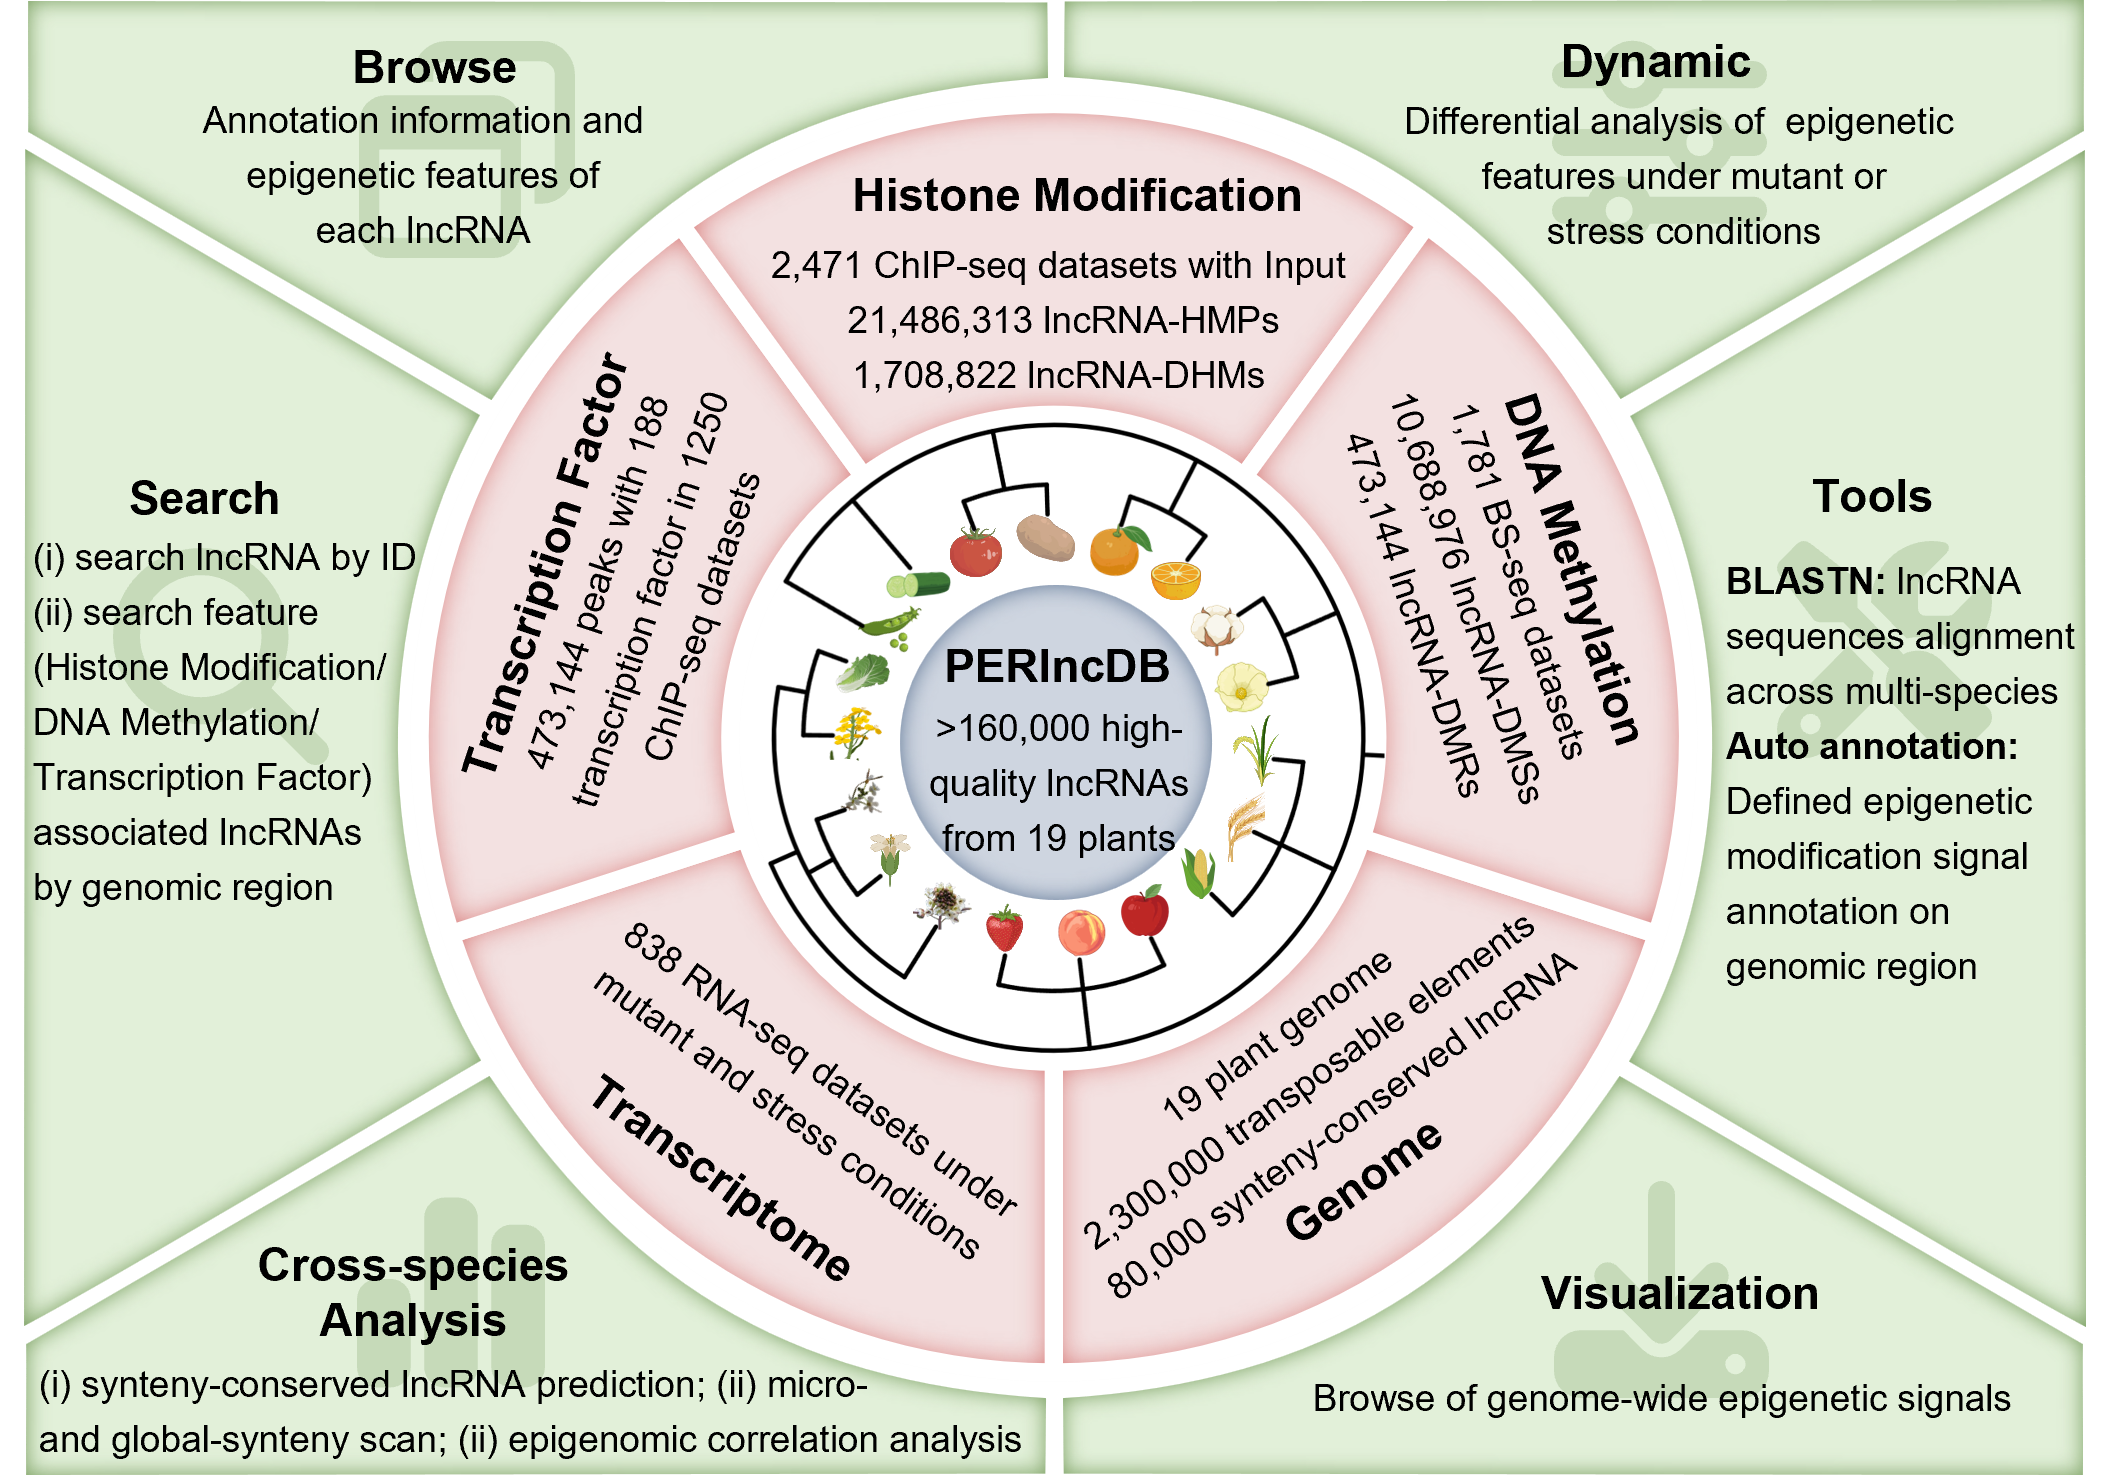
PERlncDB integrates 6,360 omics datasets from 19 species, including ChIP-seq, BS-seq, and RNA-seq, and identifies over 160,000 high-quality lncRNAs. It predicts 80,308 collinearly conserved lncRNAs based on homologous genomic blocks across species. Epigenetic modifications, including histone modifications and DNA methylation, are analyzed for genome-wide signals, differential regions, and lncRNA-associated annotations. Expression levels of lncRNAs, differential analysis, and transcription factor binding sites are also identified. All results and data are integrated and uploaded to the PERlncDB platform.
2 Overview
The Plant lncRNA Epigenetic Regulatory Database (PERlncDB) offers detailed information and visualization of 19 species of epigenetic features associated with plant lncRNAs, including Transposable Elements, Transcription Factors, Histone Modifications, and DNA Methylation. Additionally, it provides differential regulatory information on the epigenetic landscape of lncRNAs under different mutant types or stress conditions. The database primarily comprises functional modules such as Home, Browse, Search, Cross-sepcies Analysis, Dynamics, Visualization, and Tools.
3 Homepage
On the homepage of the PERlncDB, there is a navigation bar with six modules and quick access to searches for Histone Modification, DNA Methylation, and Transcription Factor. Additionally, there is a global search for lncRNA IDs and links to detailed pages for each species.

4 Browse
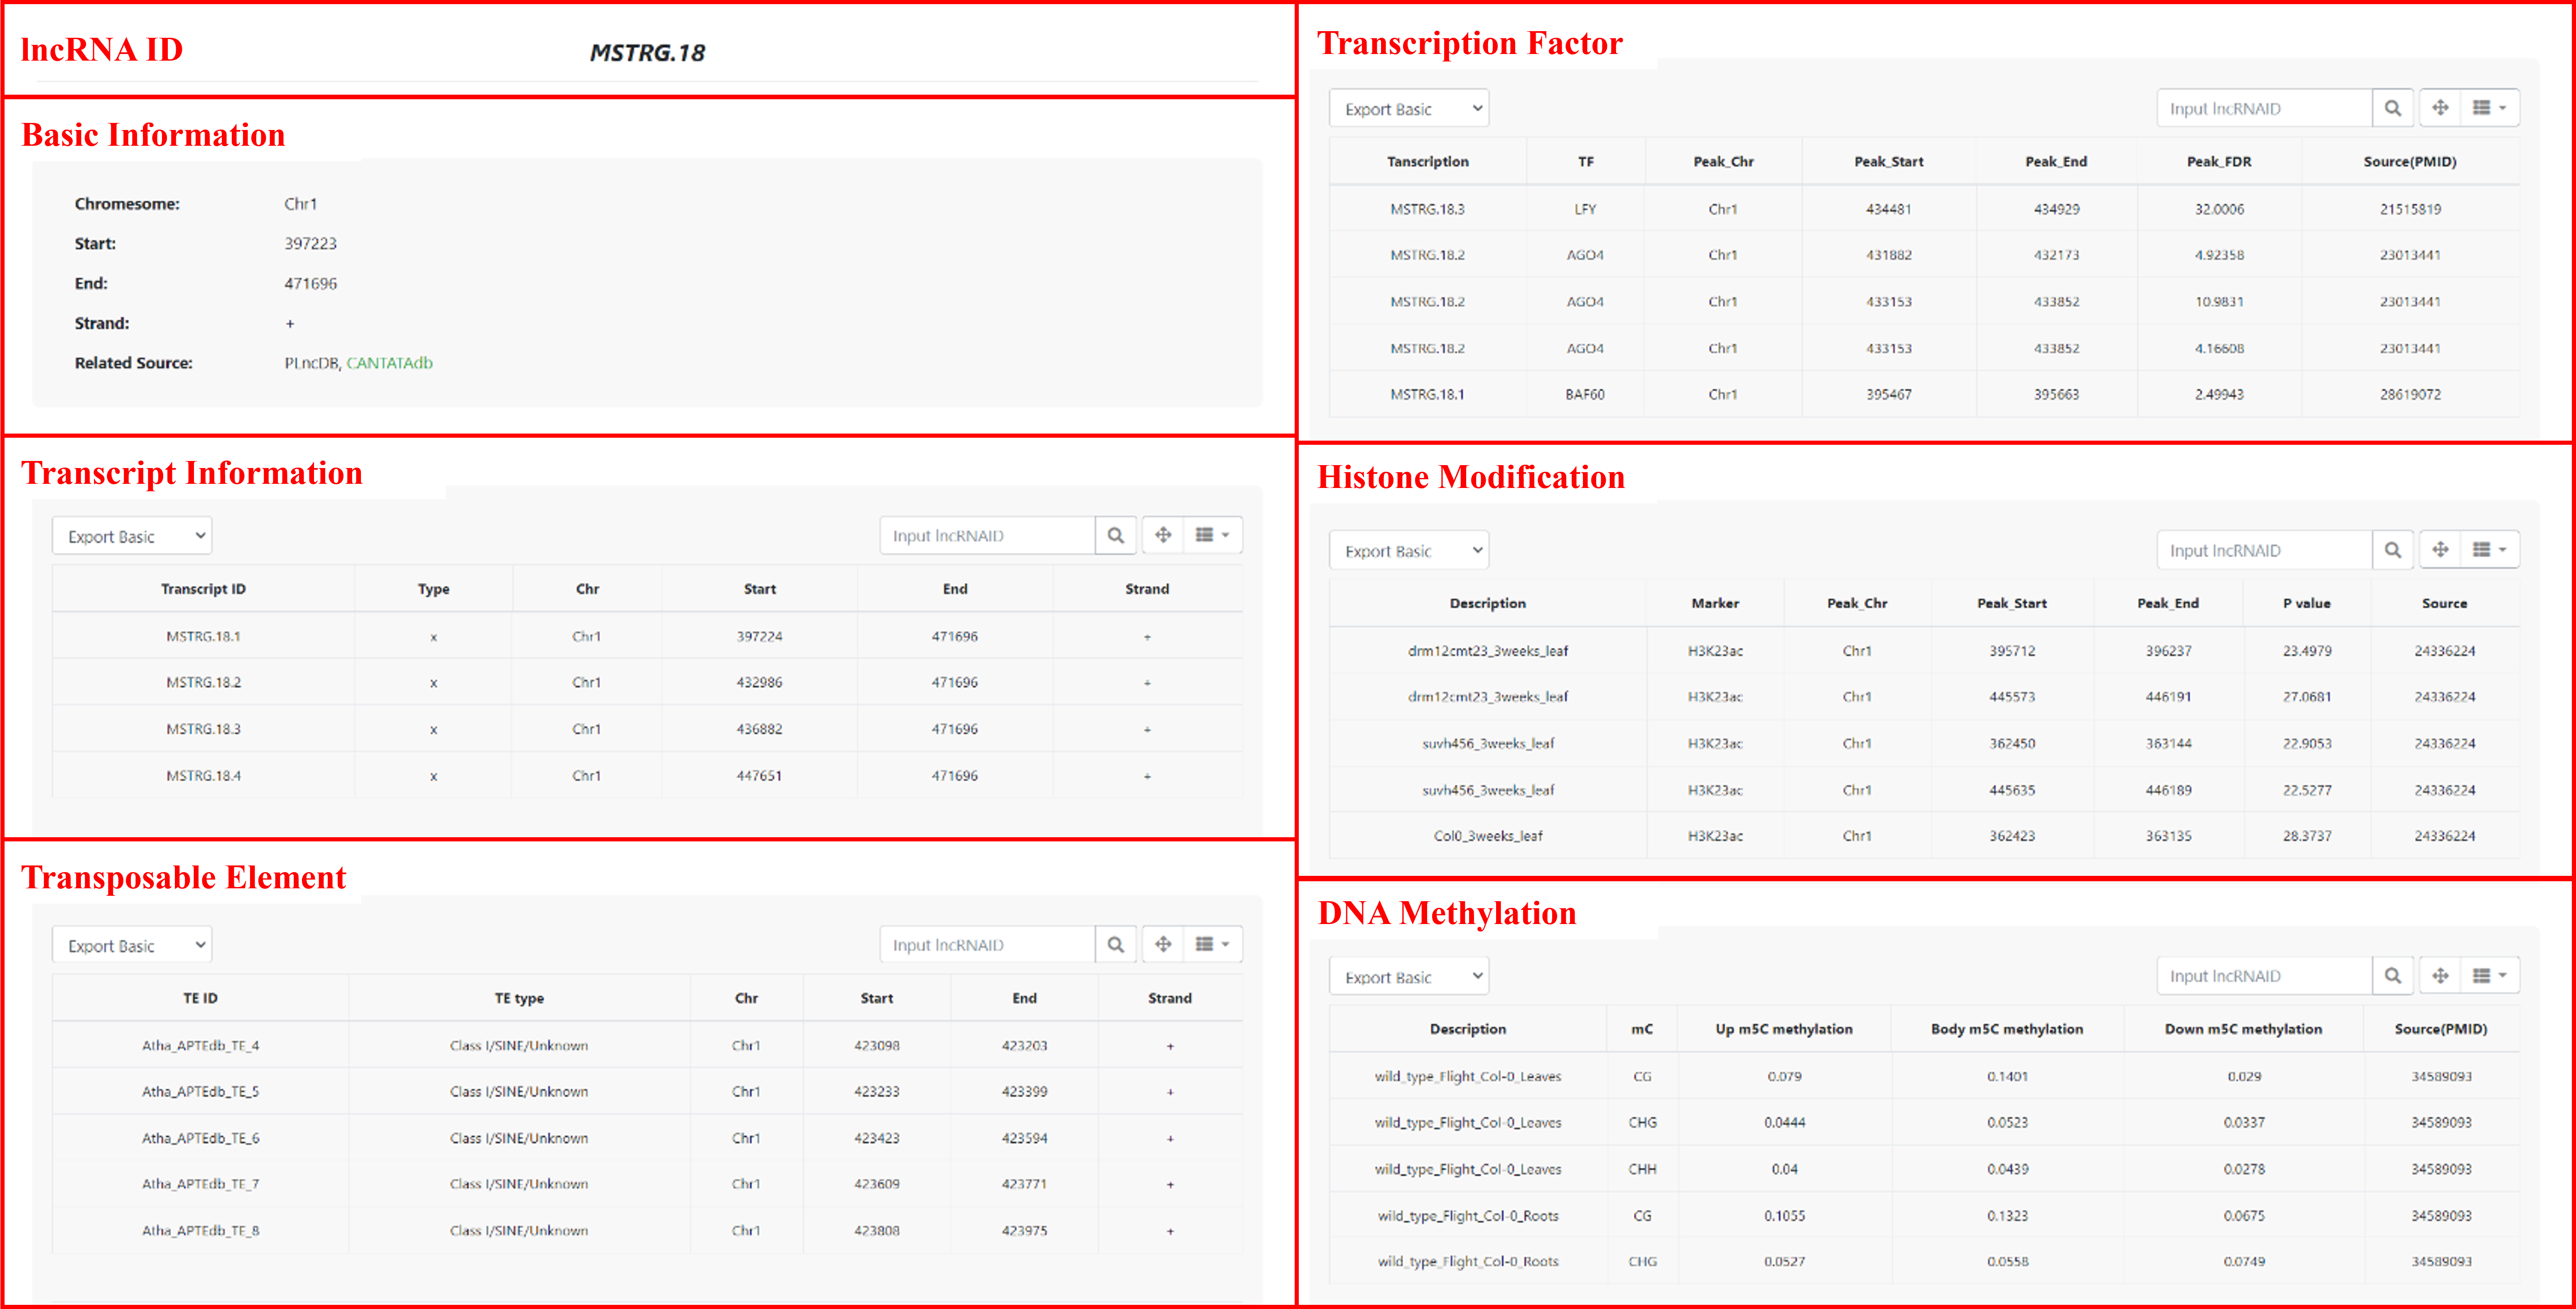
In the Browse module, genome information for each species is provided, including details such as the reference genome version, genome size, and the number of lncRNAs and genes. Additionally, there is a page dedicated to browsing lncRNAs for each species.
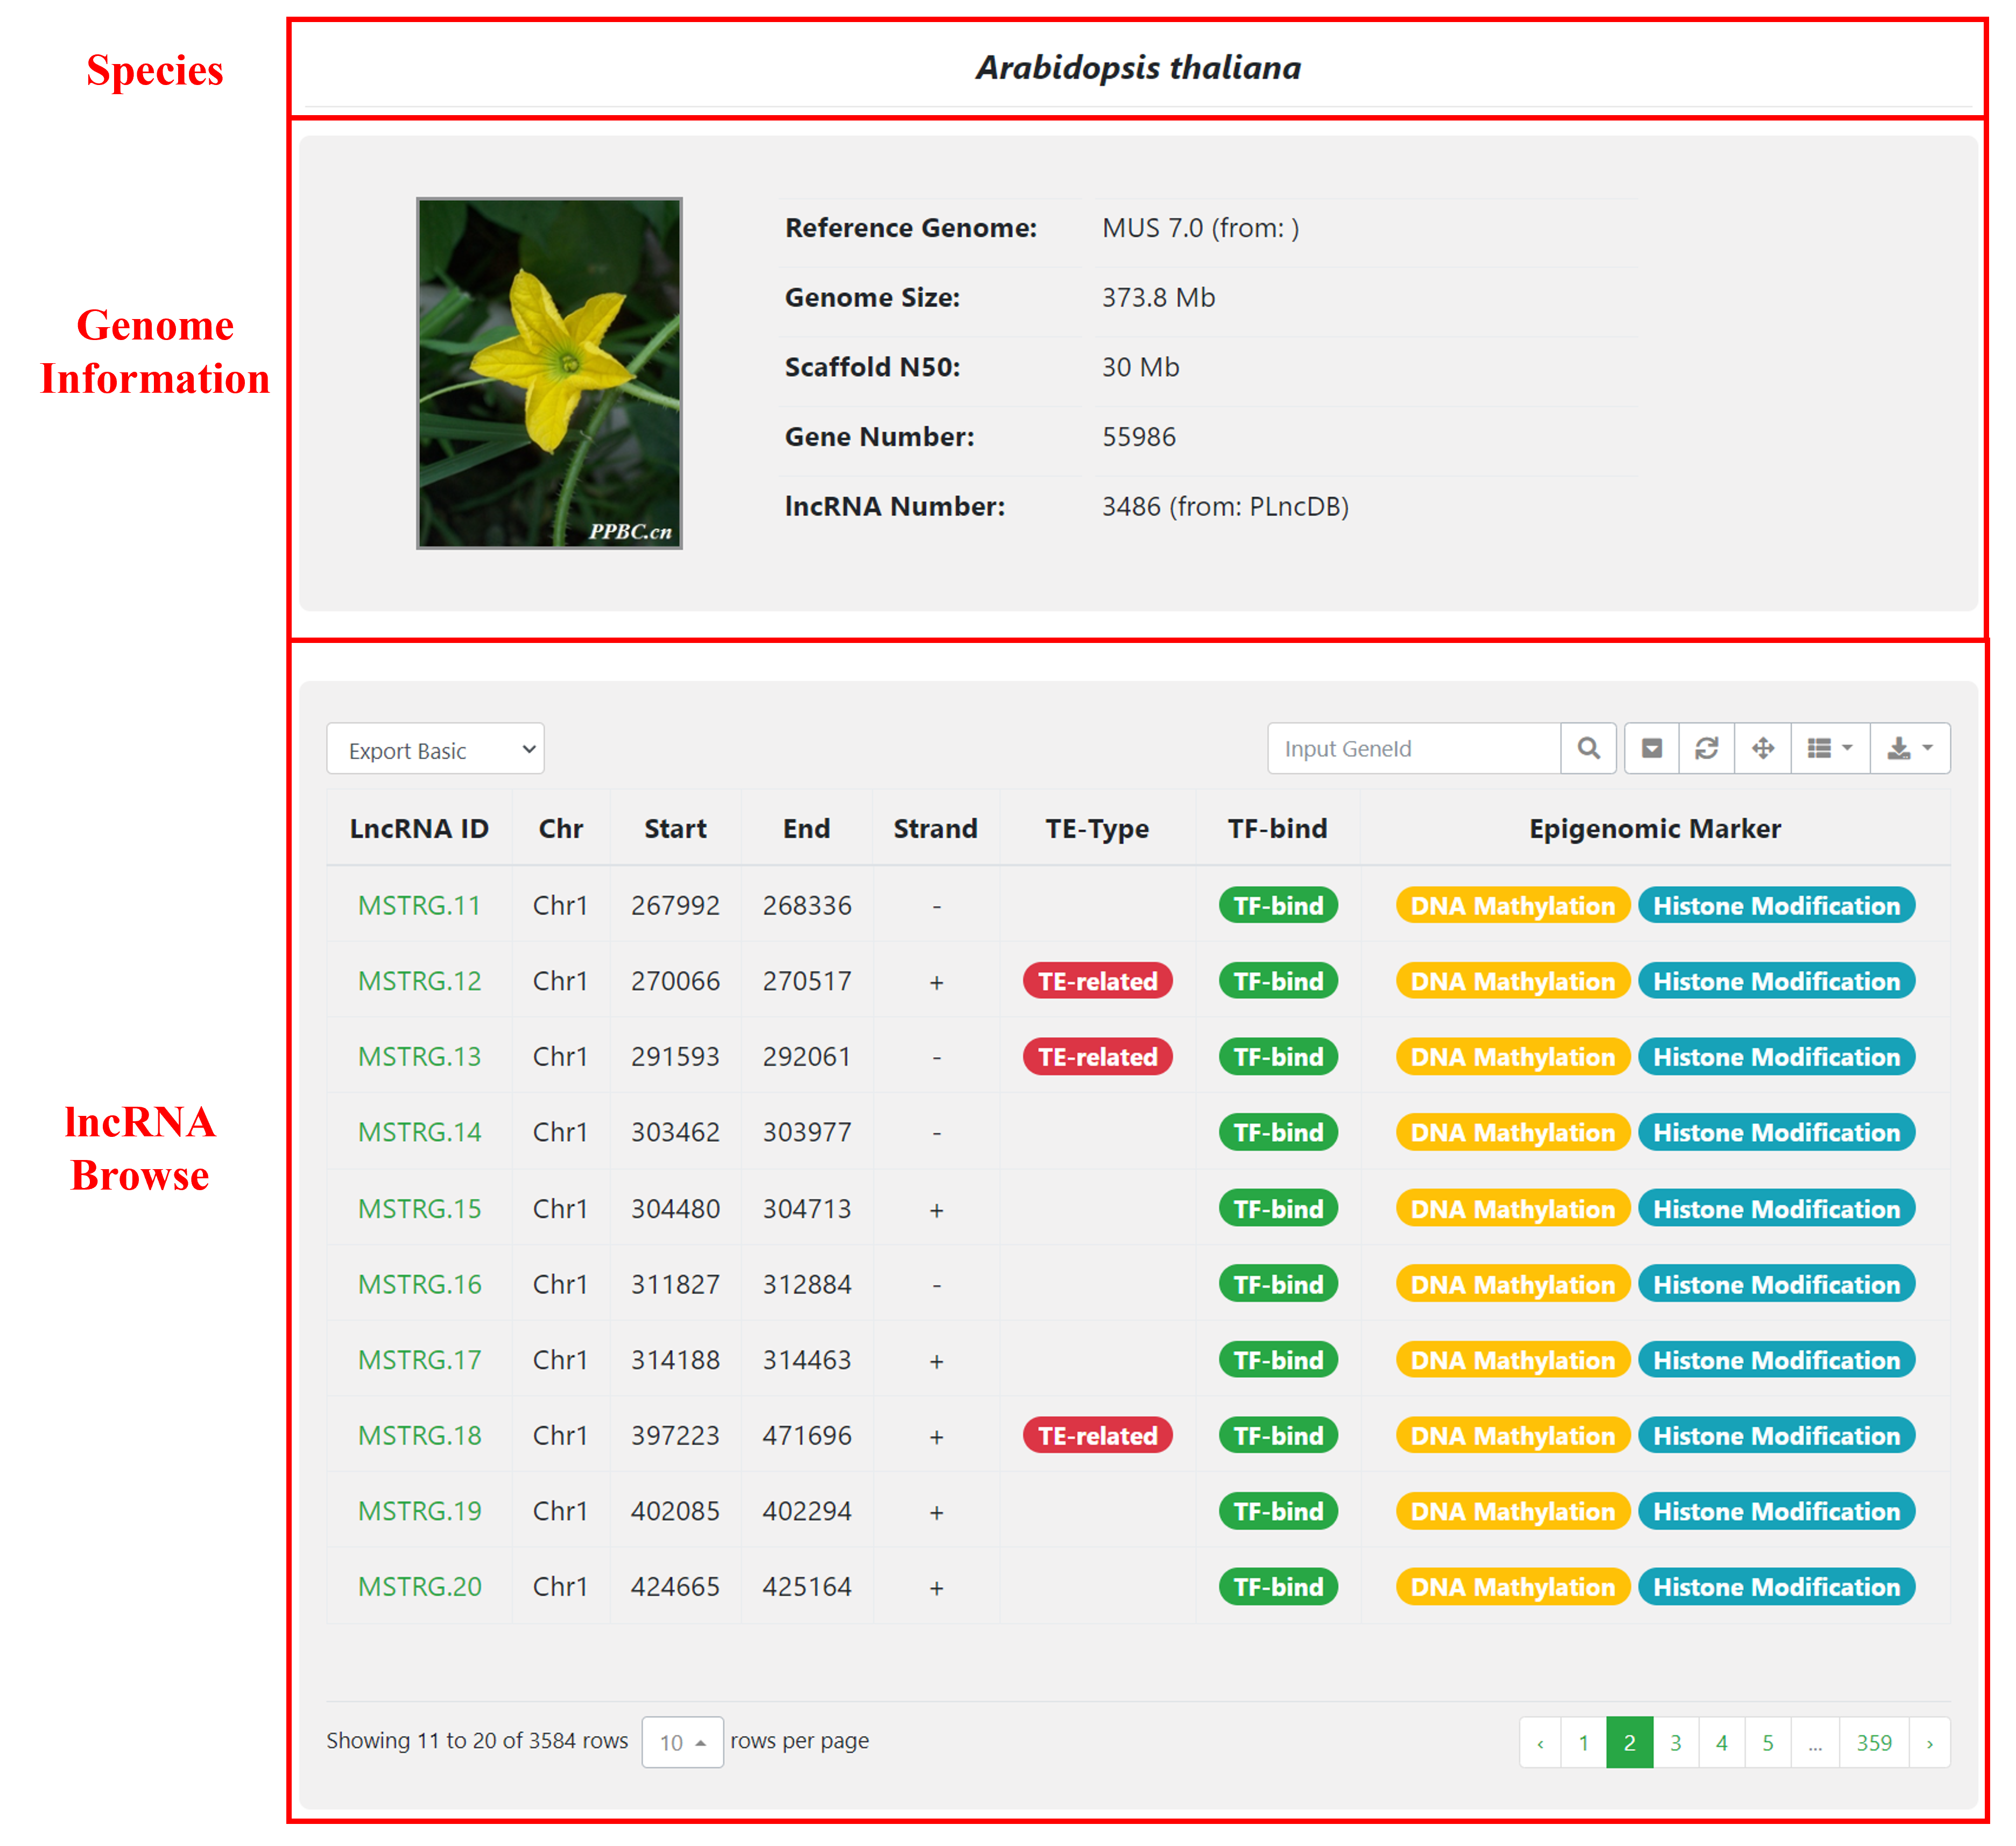
Detailed page includes a table containing basic information about lncRNAs as well as annotations for transposable elements (TEs), transcription factors (TFs), histone modifications, DNA methylation, and other relevant information.
5 Search
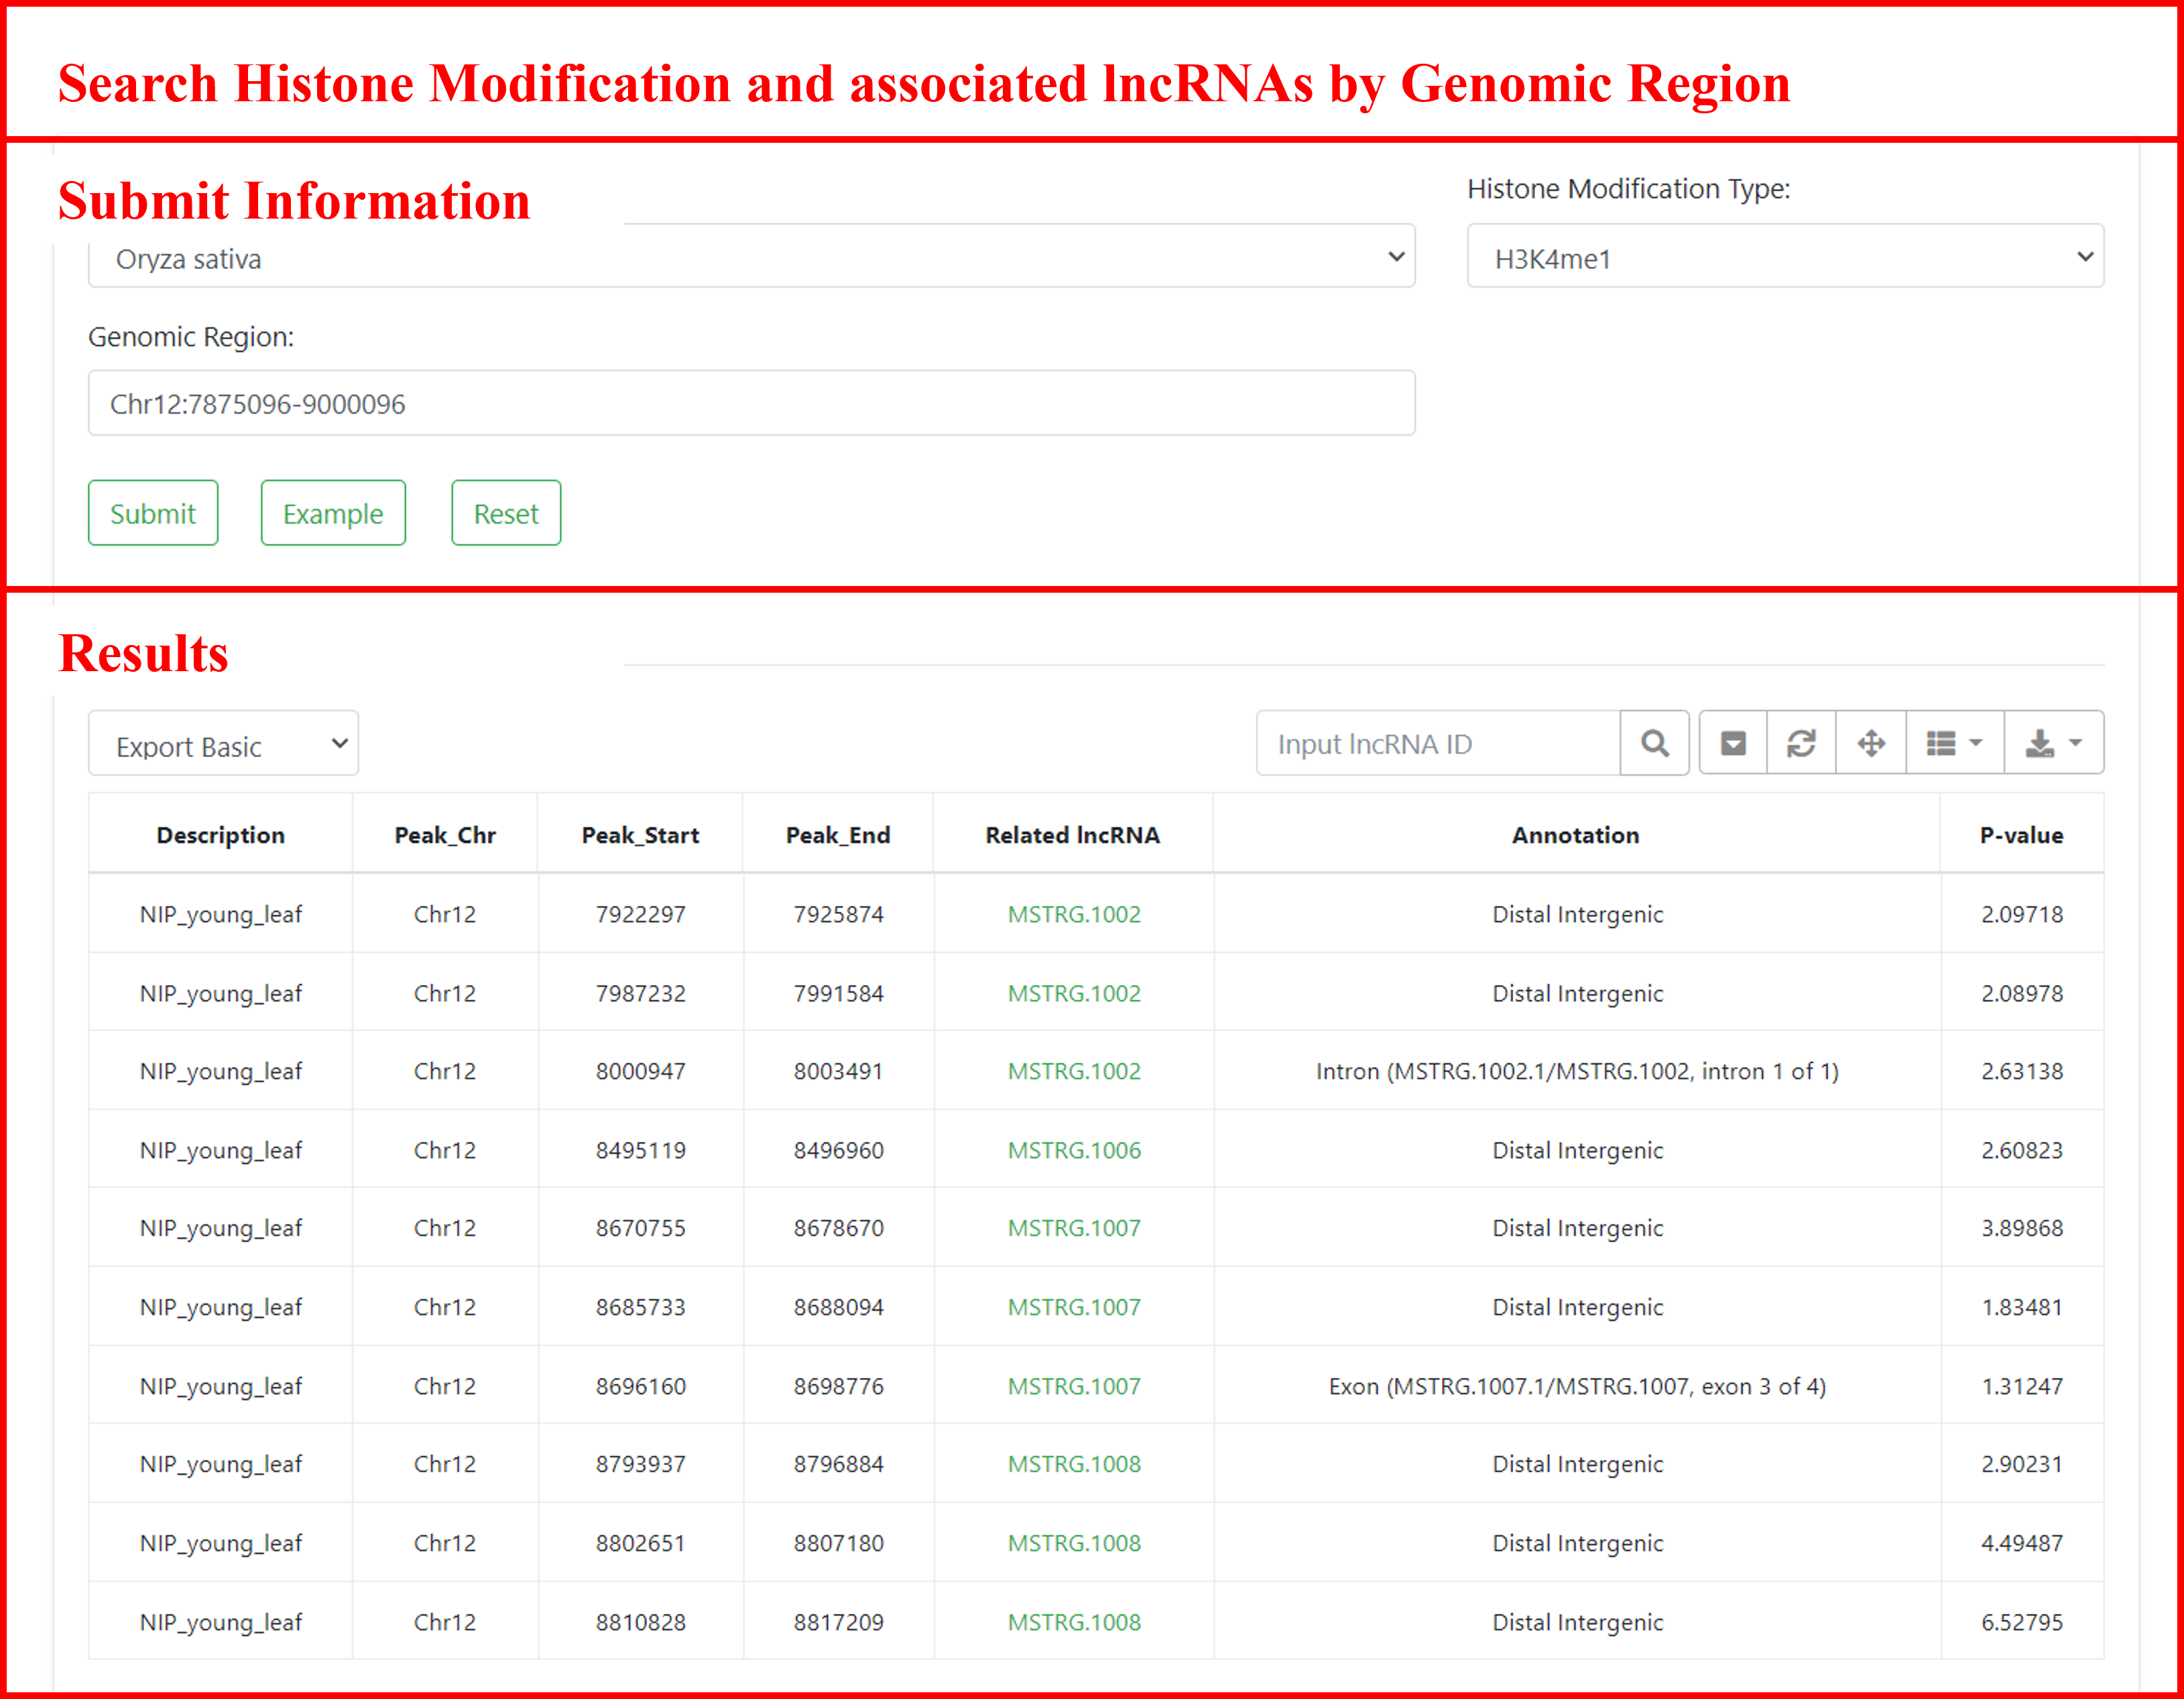
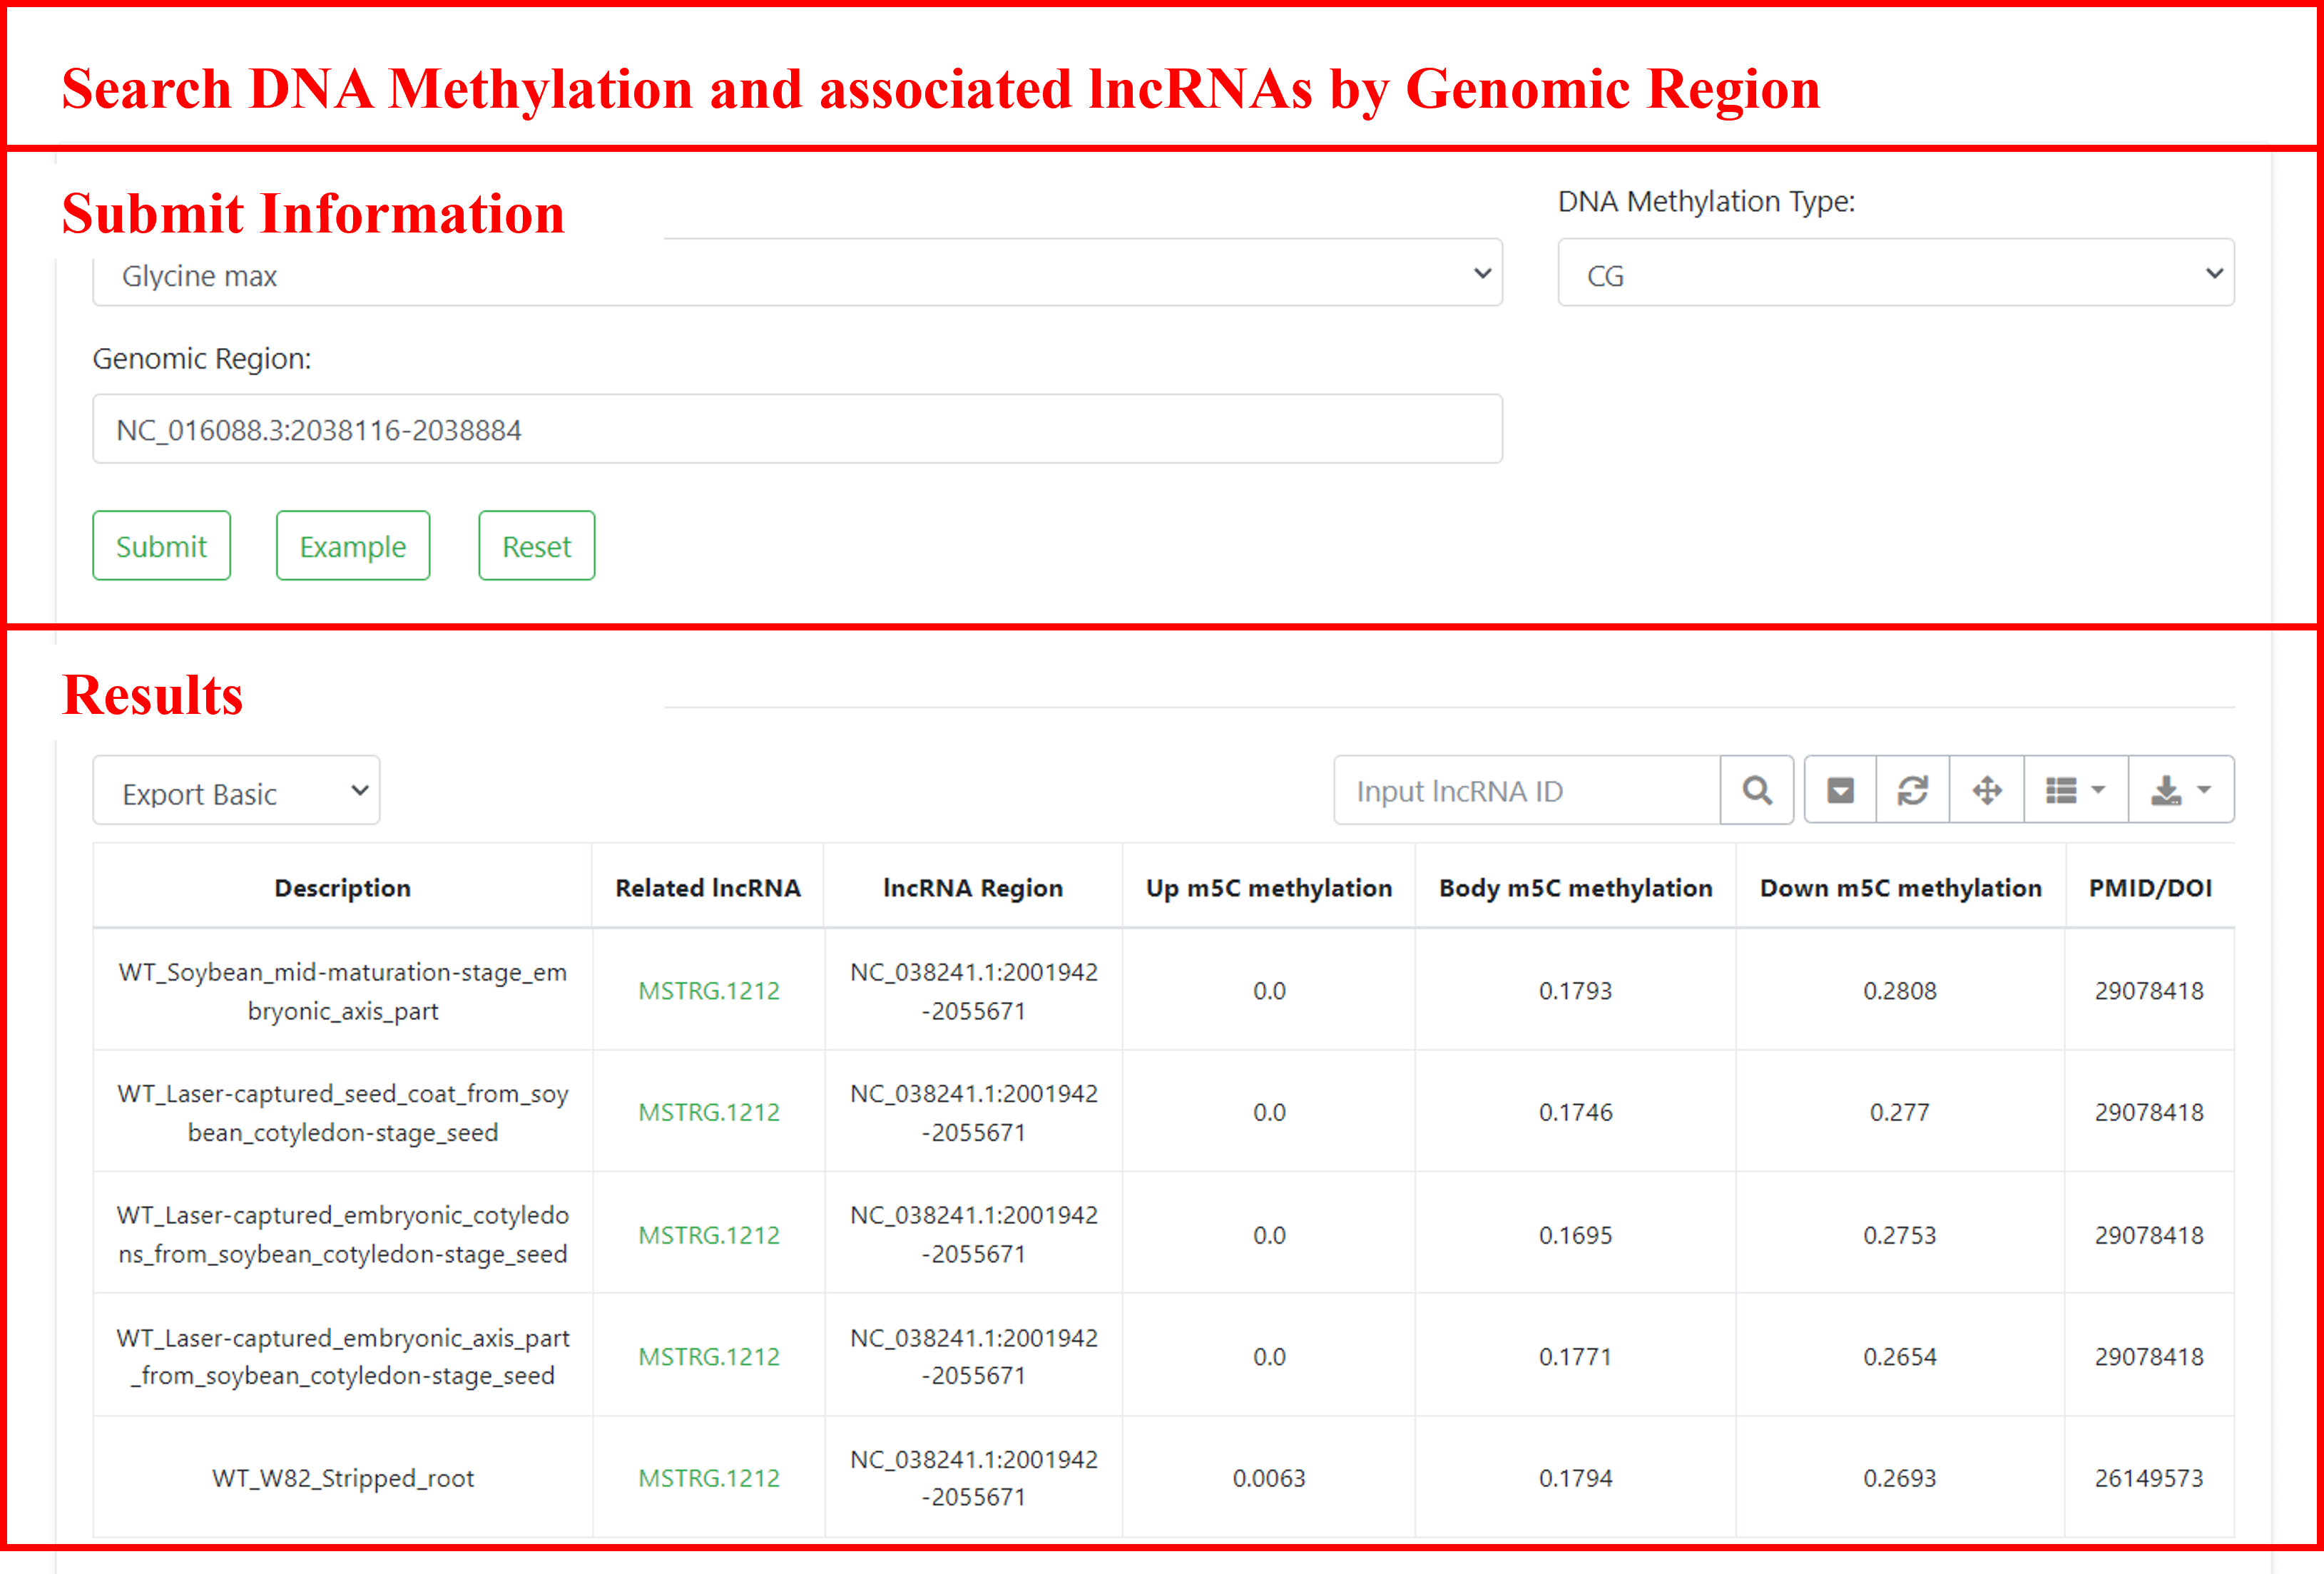
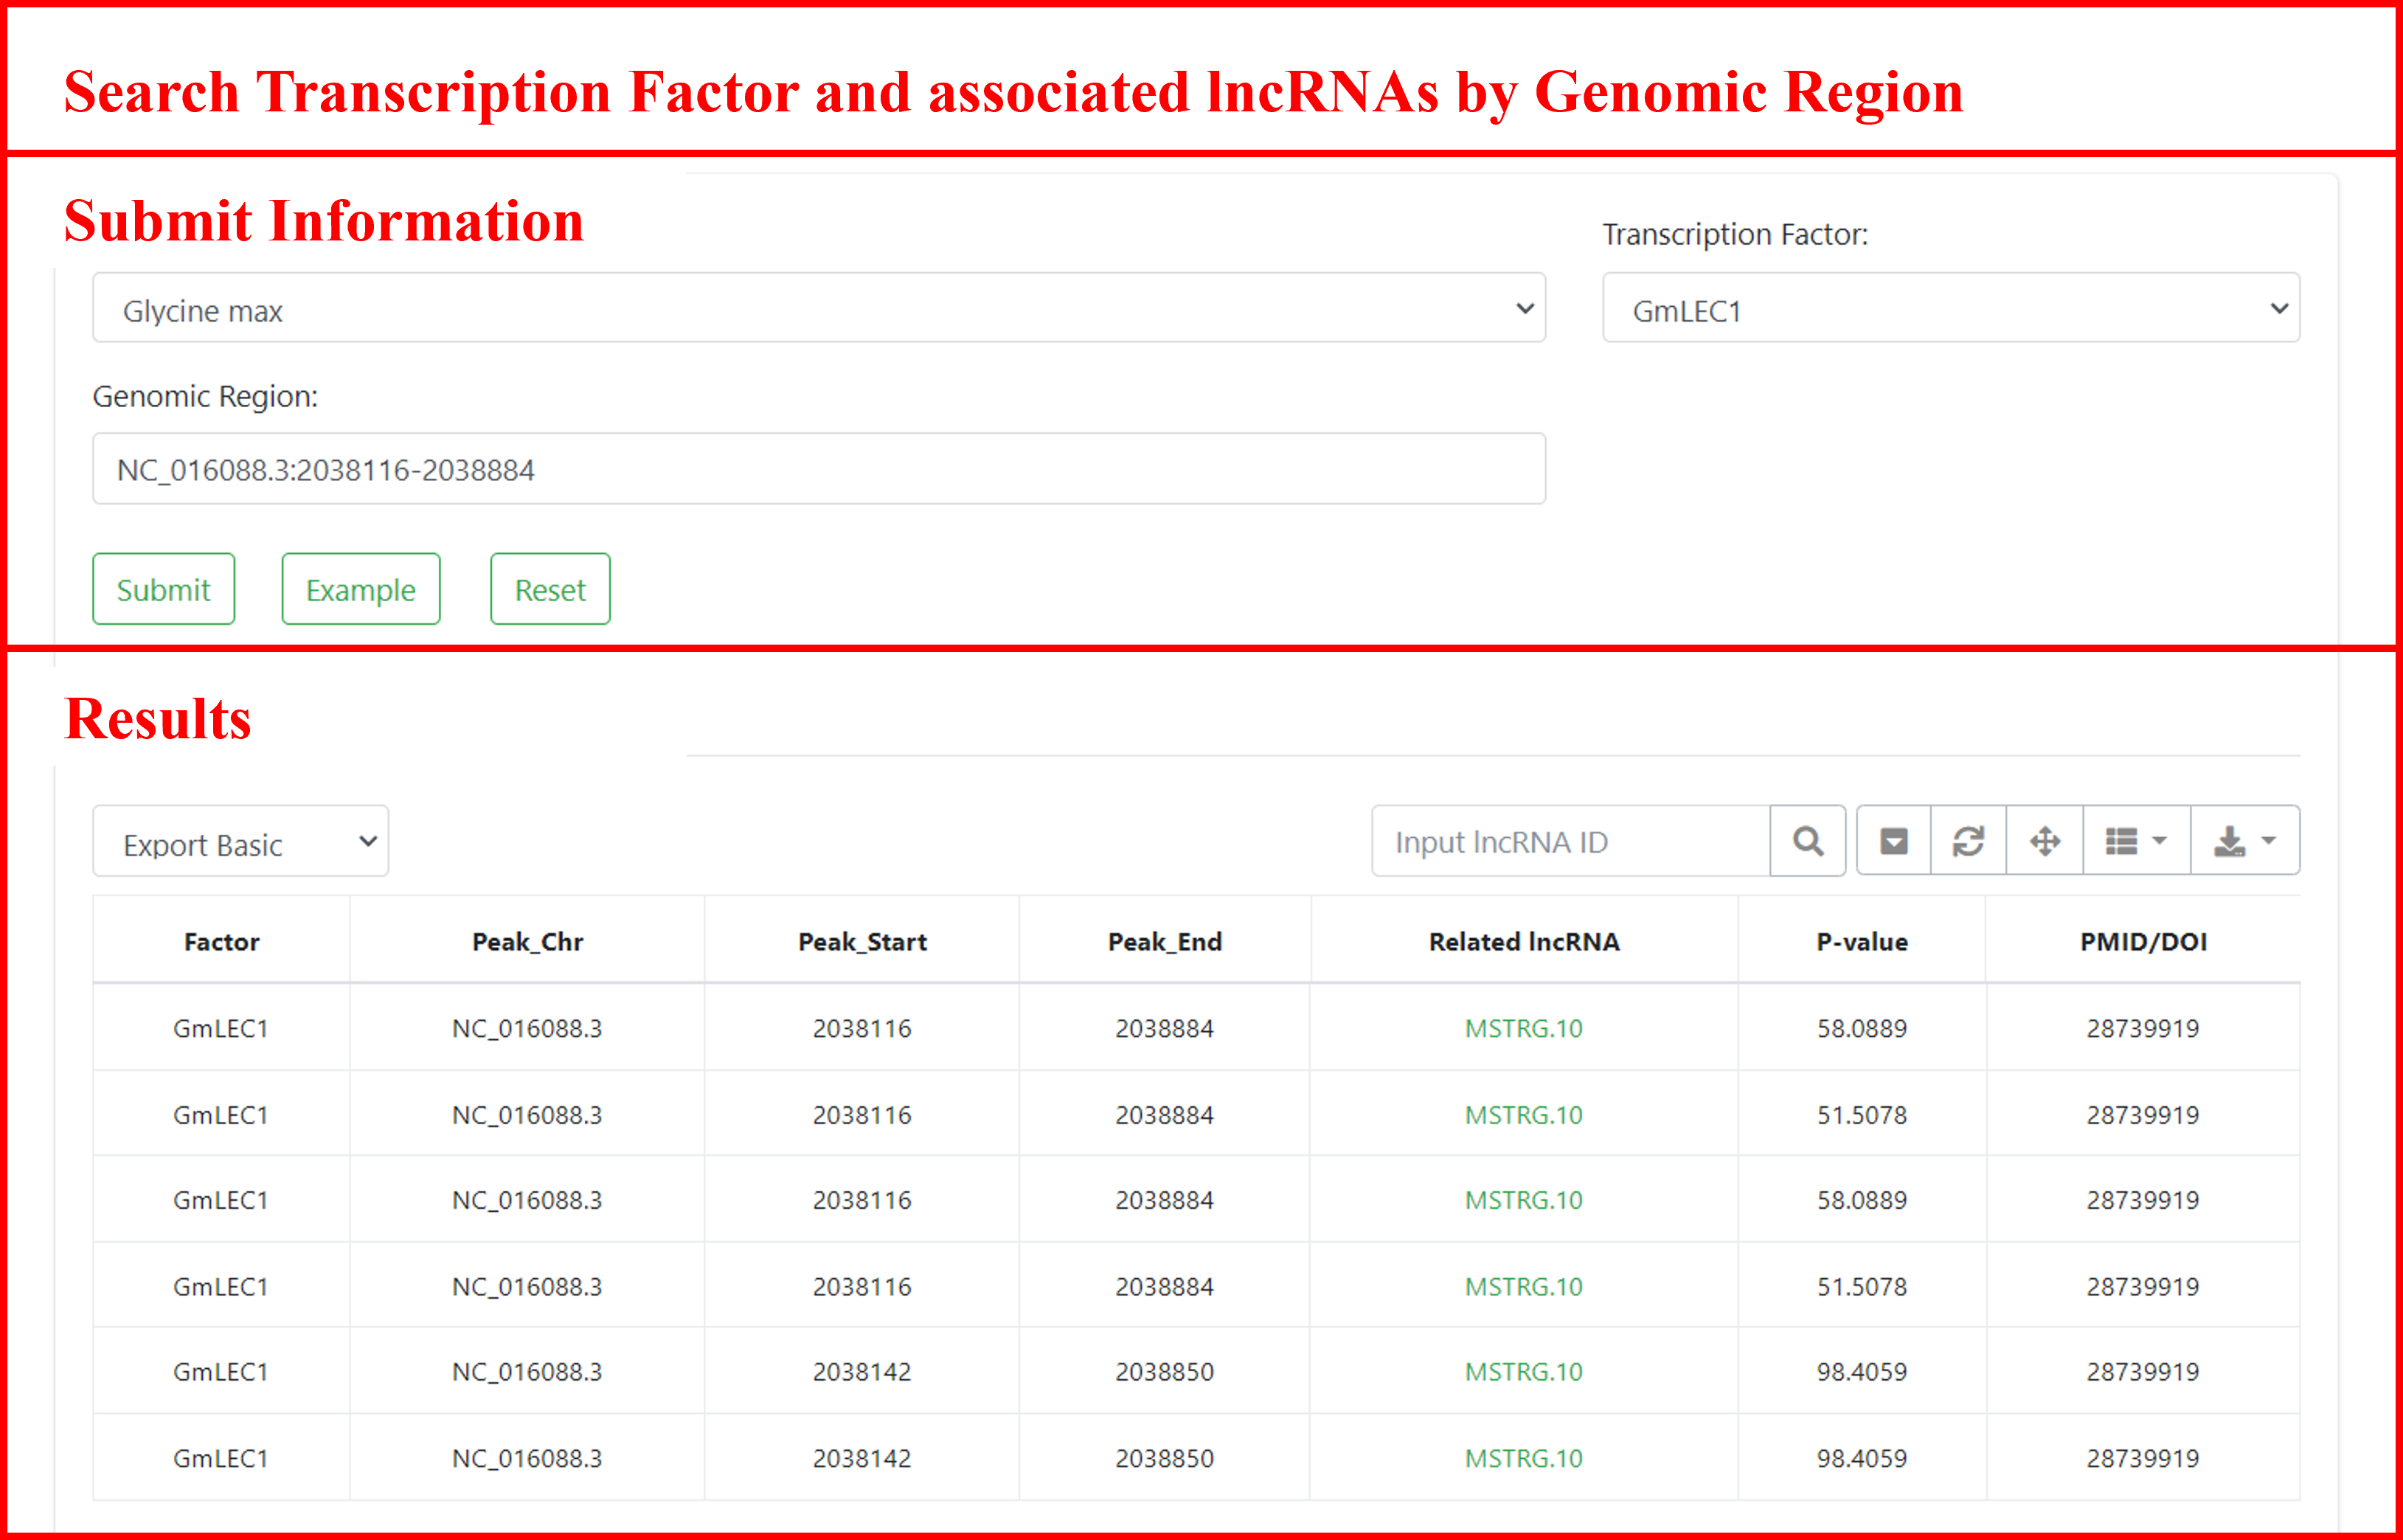
In the Search module, four search options are provided: (i) search by lncRNA ID, (ii) search by transcription factor and associated lncRNAs by genomic region, (iii) search DNA methylation and associated lncRNAs by genomic region, and (iv) search histone modifications and associated lncRNAs by genomic regions. Detailed information about the corresponding lncRNAs is also provided for each search option.
5.1 Search by lncRNA ID
Direct search by lncRNA ID. Users can perform a direct search by submitting genome information and lncRNA ID details. Upon submission, they receive information about the transcript of the input lncRNA, its location, strand orientation, type, and more. Additionally, users can navigate to the detailed page of the gene by clicking on the lncRNA ID.

5.2 Search by transcription factor and associated lncRNAs by genomic region
Searching for histone modifications in specific genomic regions, and finding associated regions and lncRNAs. Users can submit the species of interest, histone modification type, and genomic region to retrieve information about relevant histone modification regions, including sample descriptions, tissues, histone modification regions, associated lncRNAs and annotations, sample sources, and more. Additionally, users can navigate to the detailed page of the gene by clicking on the lncRNA ID.
5.3 Search DNA methylation and associated lncRNAs by genomic region
Searching for DNA methylation regions in specific genomic regions, and finding associated regions and lncRNAs. Users can submit the species of interest, DNA methylation type, and genomic region to retrieve information about relevant DNA methylation regions, including sample descriptions, methylation levels of associated lncRNAs (upstream, gene body, downstream), sample sources, and more. Additionally, users can navigate to the detailed page of the gene by clicking on the lncRNA ID.
5.4 Search histone modifications and associated lncRNAs by genomic regions
Searching for transcription factor binding sites in specific genomic regions, and finding associated regions and lncRNAs. Users can submit the species of interest, transcription factor type, and genomic region to retrieve information about relevant regions, including sample descriptions, locations, associated lncRNAs, sample sources, and more. Additionally, users can navigate to the detailed page of the gene by clicking on the lncRNA ID.
6 Cross-sepcies Analysis
This module provide “Synteny-conserved LncRNA Prediction”, “LncRNA Synteny Scan” and “Epigenomic Correlation” to explore the epigenomic features by conserved lncRNAs pairs across multiple species.
6.1 Synteny-conserved LncRNA Prediction
Synteny conservation, defined as the evolutionary maintenance of gene order and genomic organization across species, serves as the cornerstone of our lncRNA identification pipeline. Through genome-wide analysis of homologous blocks, we have systematically predicted 84,602 conserved syntenic lncRNAs across 19 species, anchored within 234,350 syntenic blocks. For each query lncRNA, our pipeline precisely maps it to syntenic blocks in target genomes and identifies all potential synteny-conserved lncRNAs within these evolutionarily conserved genomic regions.
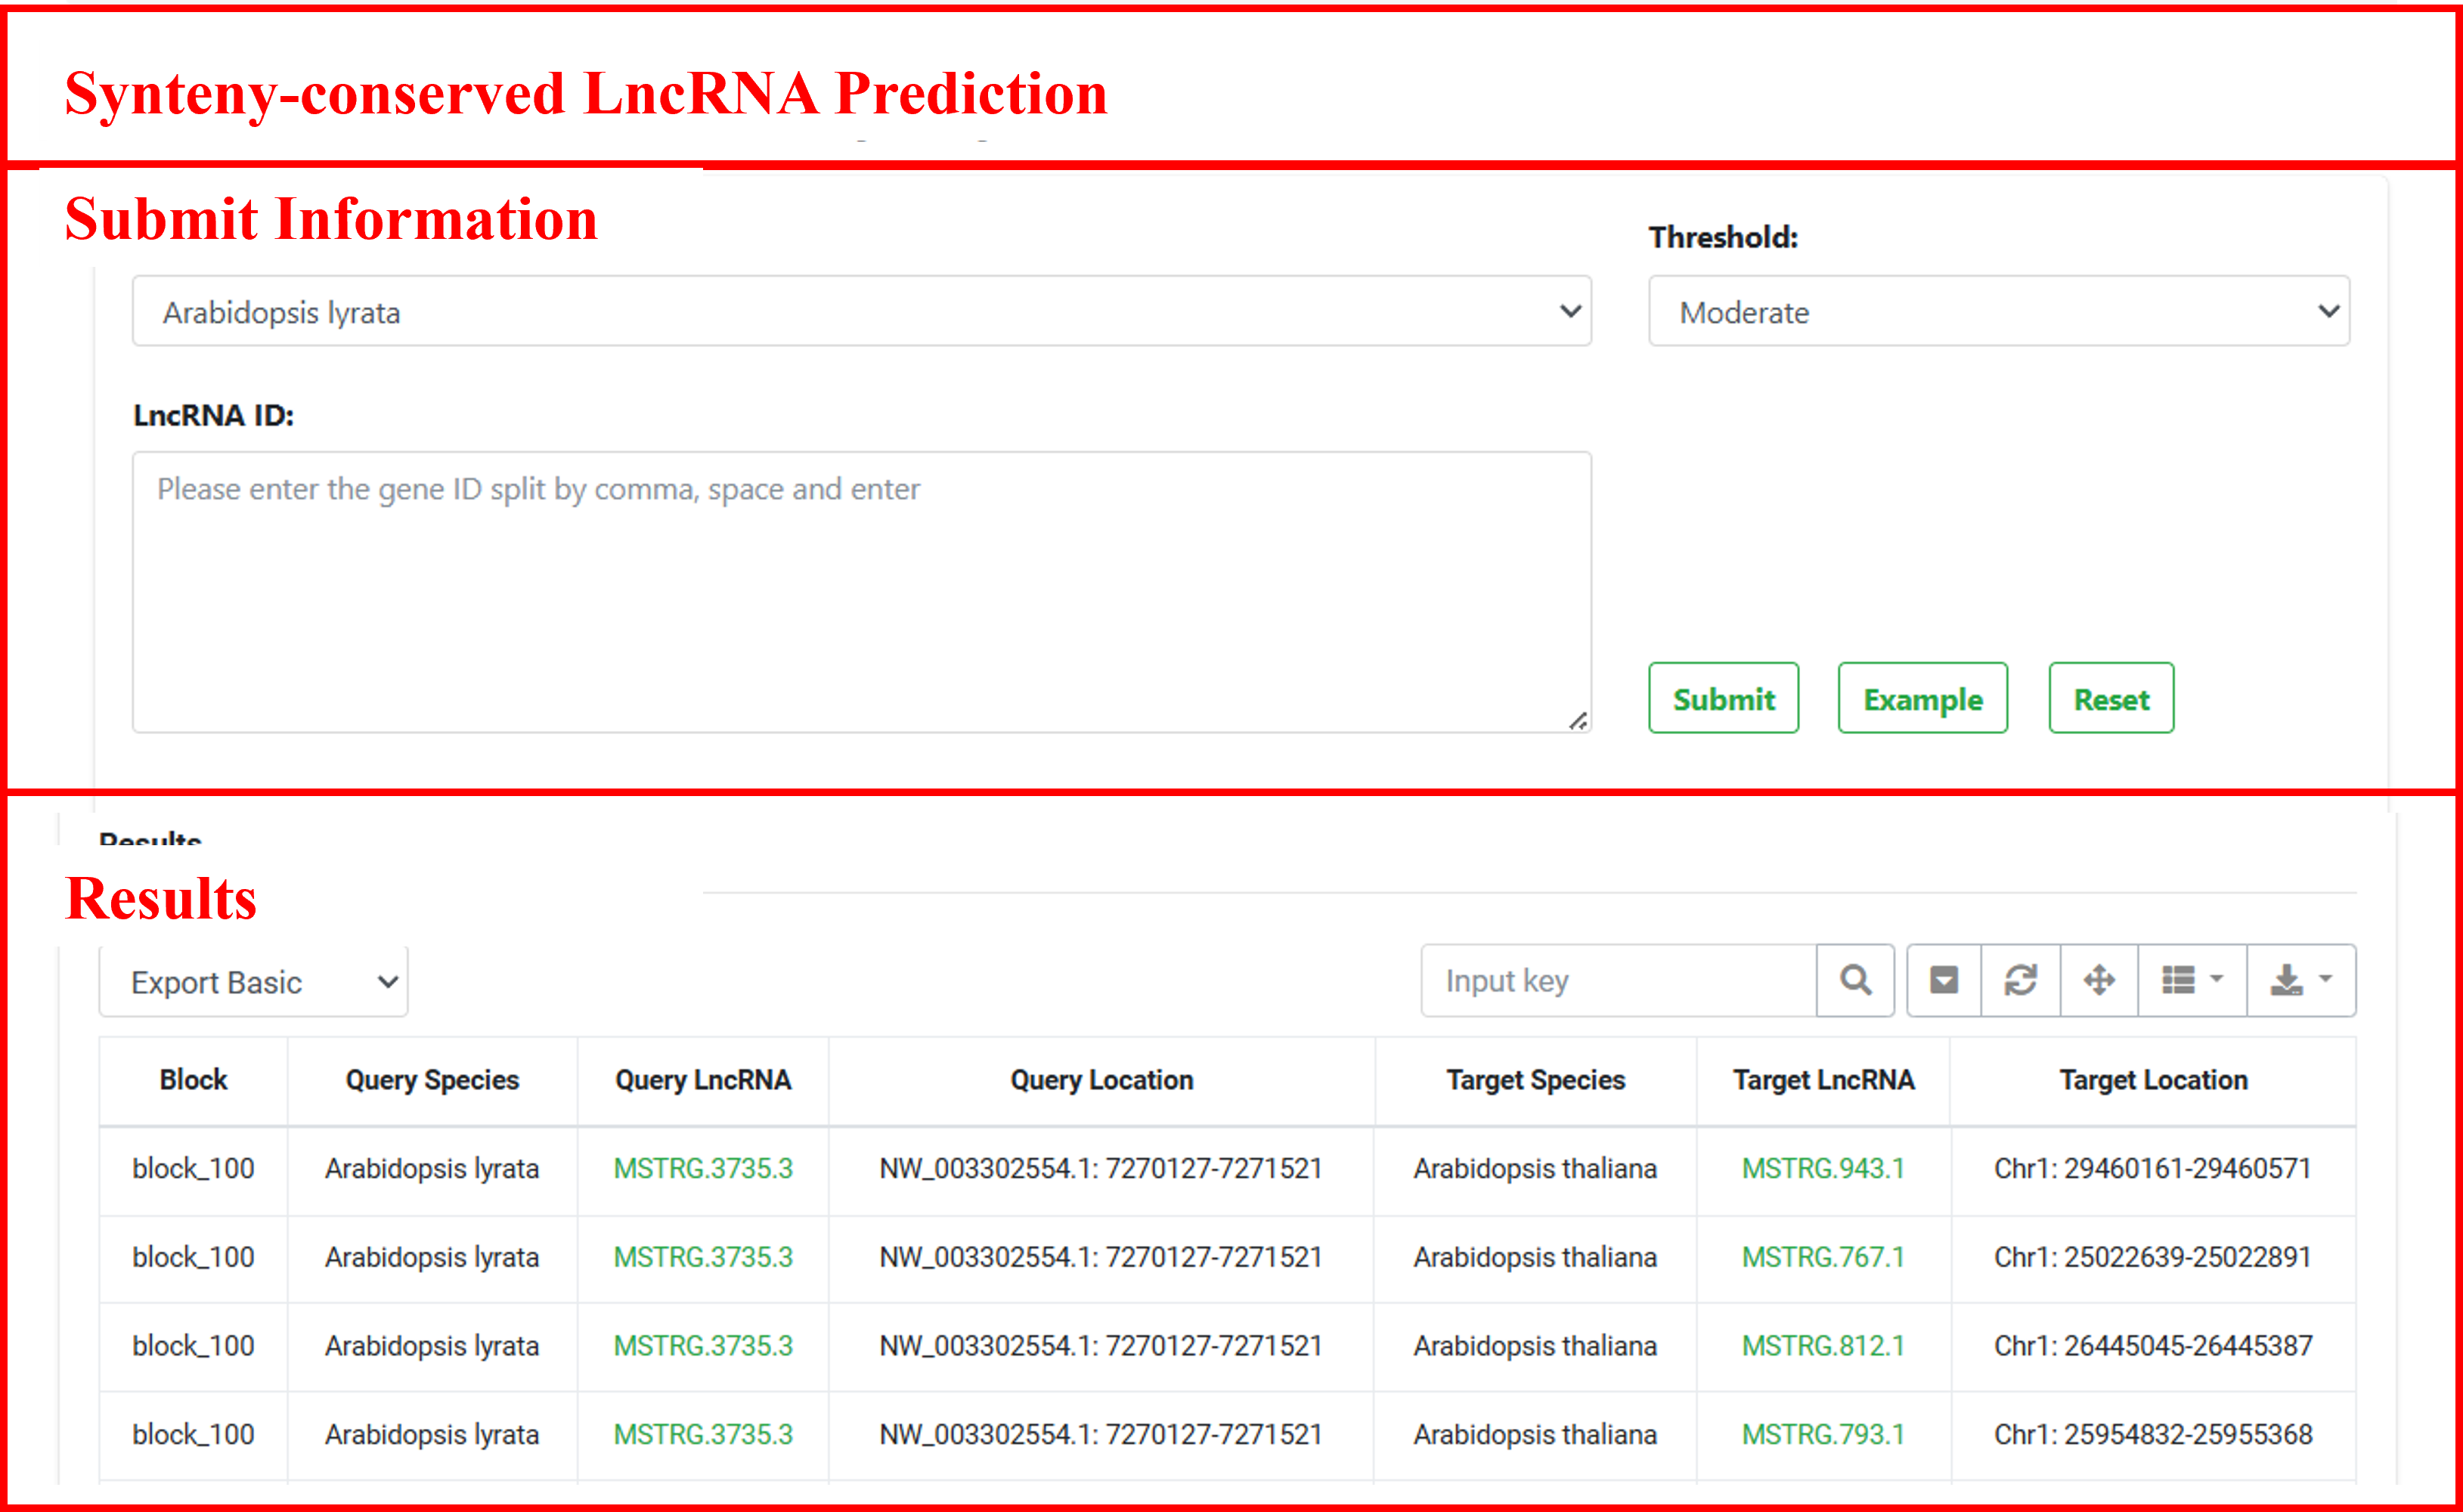
JCVI was used to construct whole-genome syntenic blocks based on protein-coding gene sequence homology between species. And then, we employ two core criteria to screen for synteny-conserved lncRNAs based on each block. LncRNAs were classified as synteny-conserved when meeting dual criteria: (i) at least five (moderate criterion) adjacent homologous protein-coding genes must be syntenic between the two species; and (ii) transcriptional orientation concordance with any neighboring homologous coding gene.
To accommodate diverse research requirements, we implemented a tiered classification system incorporating based on the number of adjacent homologous coding genes: (i) Lenient (≥3 genes): optimized for lncRNA detection sensitivity, suitable for initial exploration; (ii) Moderate (≥5 genes): as the main classification criterion, balancing sensitivity and specificity; (iii) Strict threshold (≥10 genes and in the same transcriptional direction as the most proximal homologous coding gene): dedicated to high-confidence assessment of deeply conserved functional elements.
Additionally, we provide three sets of BLASTN results for the sequence alignment between the query lncRNA and syntenic conserved lncRNAs as references: (i) Reciprocal BLASTN results of lncRNAs between the two species; (ii) Sequence alignment of the 200 bp region surrounding the transcription start site (TSS-200bp); (iii) Sequence alignment of the 200 bp region surrounding the transcription termination site (TTS-200bp). Click the "+" sign on the left side of each row in the results table to view detailed alignment information. If nothing is displayed, it indicates no matching entries were found.
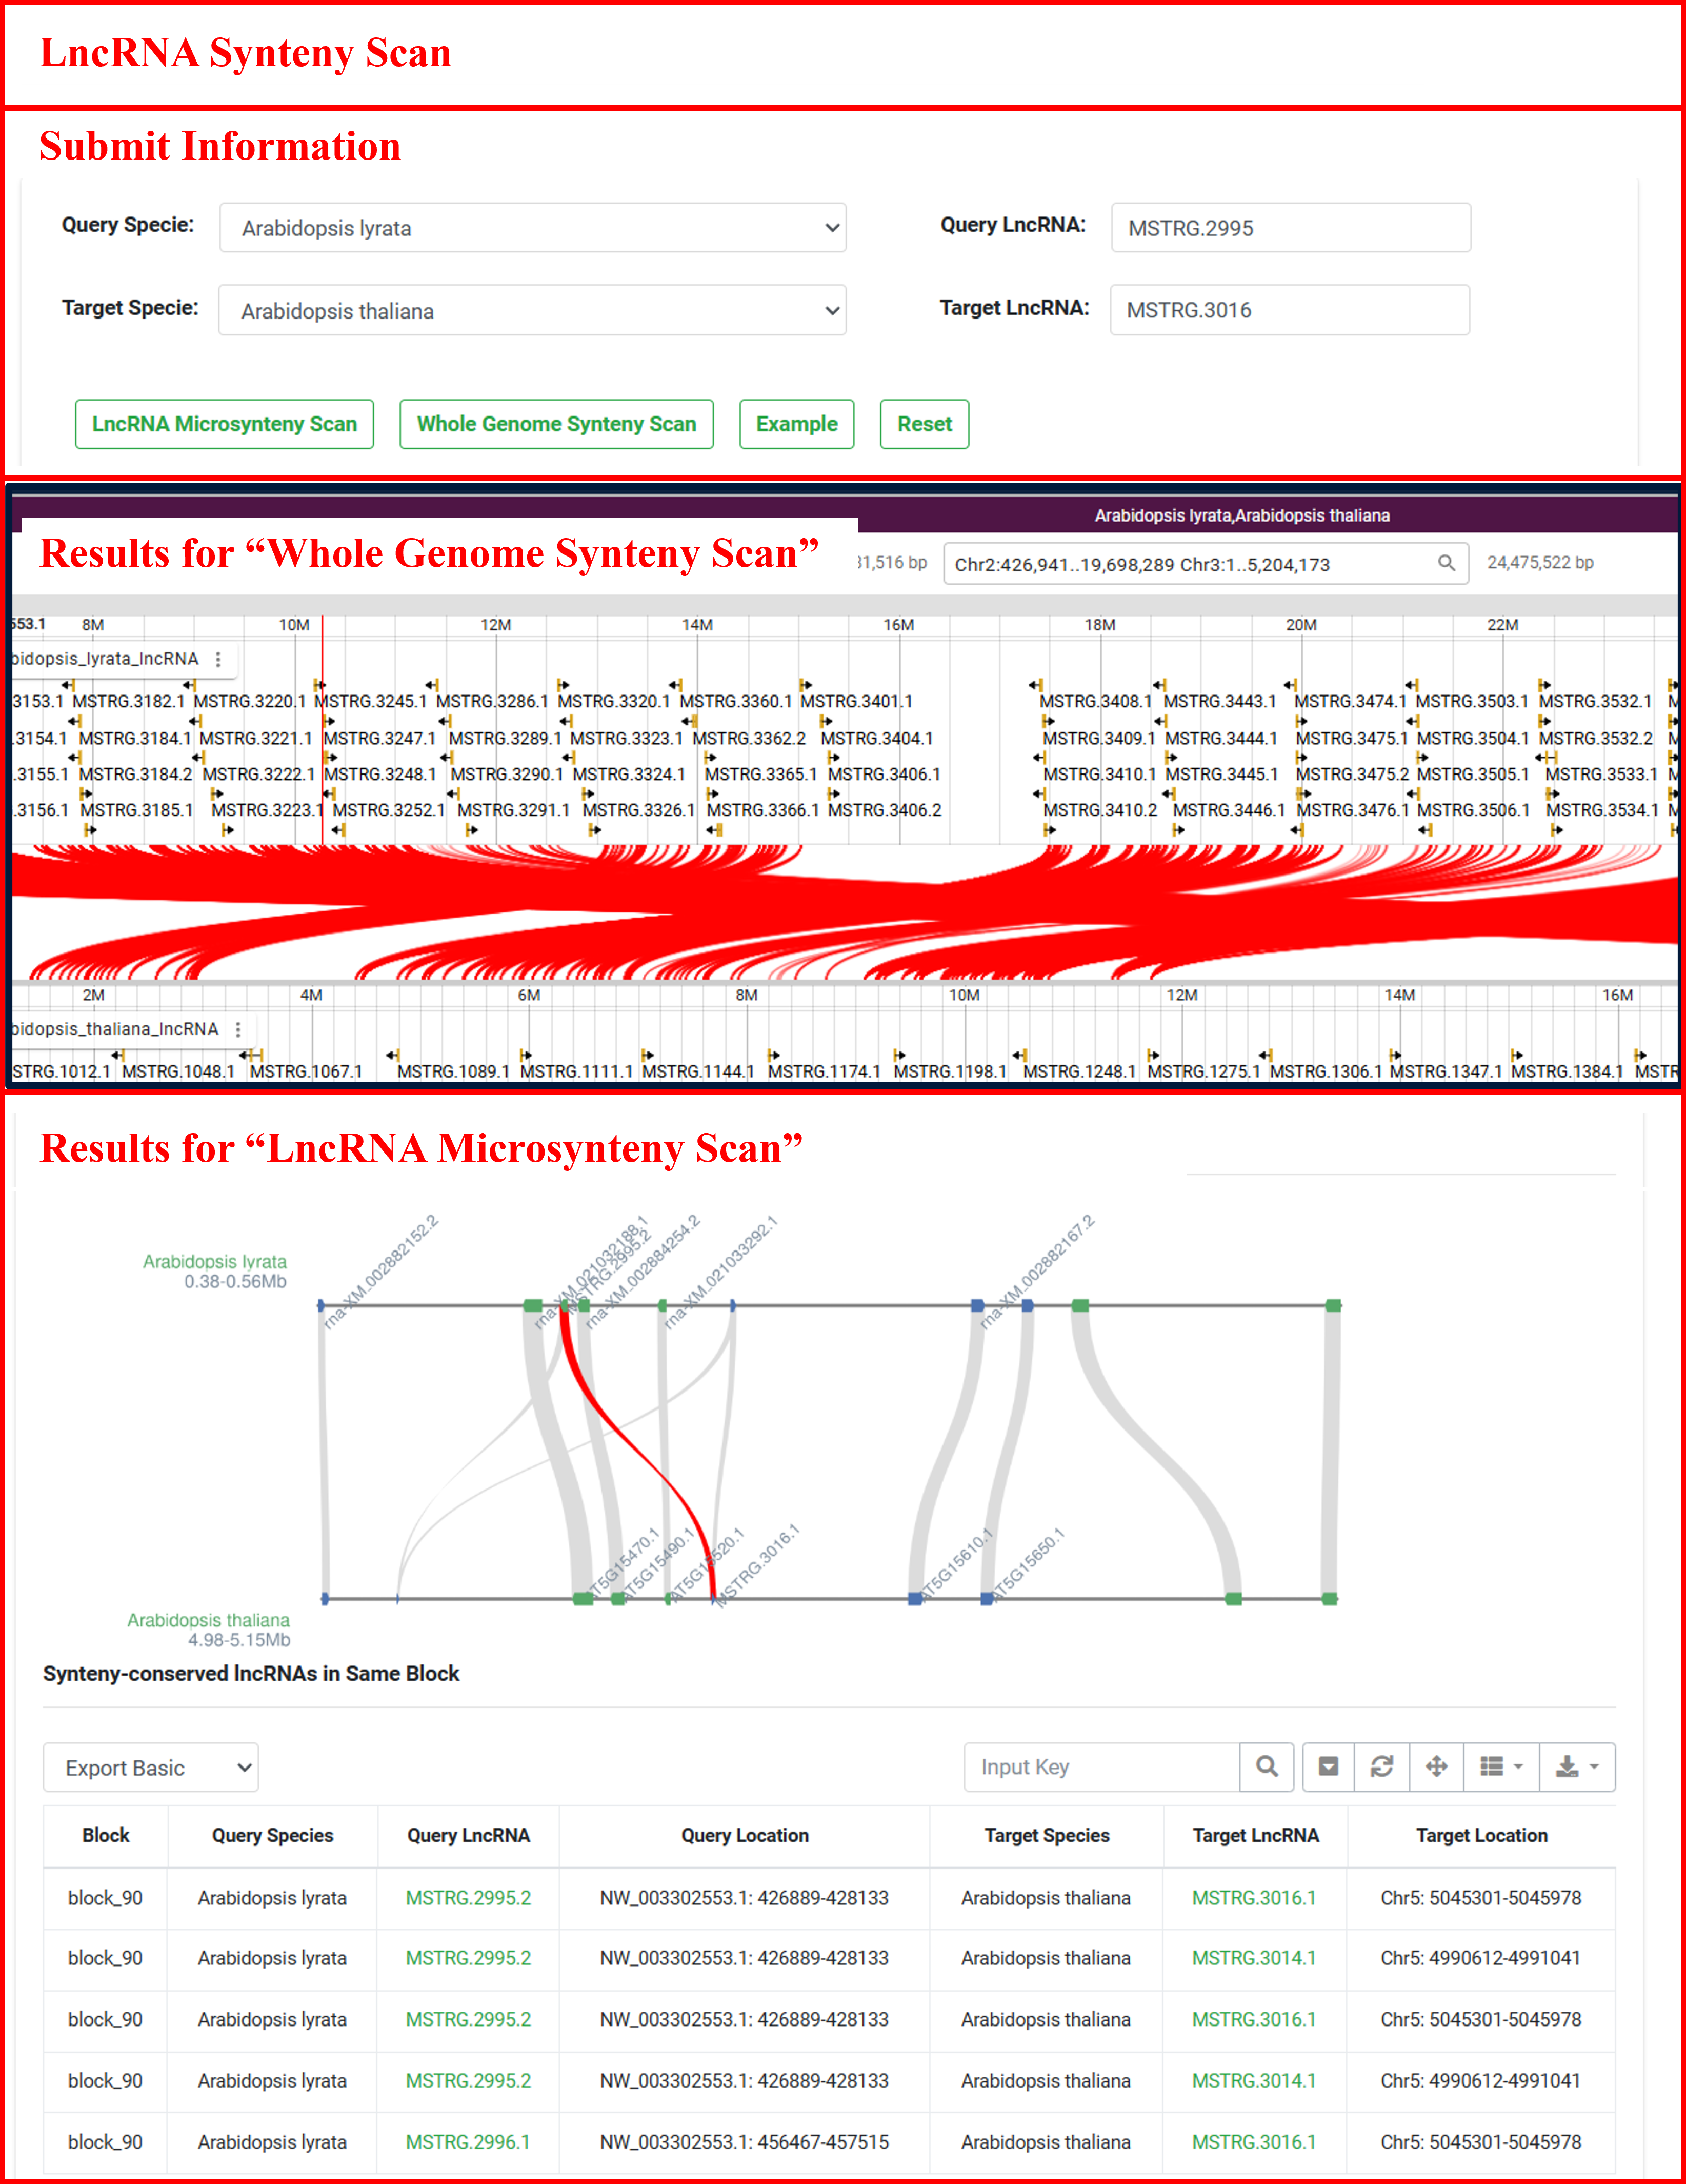
6.2 LncRNA Synteny Scan
The “LncRNA Synteny Scan” offers comprehensive tools for visualizing lncRNA synteny, enabling users to explore syntenic relationships across entire genomes or specific regions. By submitting a query species and synteny-conserved lncRNA pairs of interest, users can access detailed visualizations of local syntenic blocks as well as global synteny displays between two species. The results display all syntenically conserved lncRNAs and their homologous coding genes within the same synteny block as the lncRNA pair specified in the user query.
6.3 Epigenomic Correlation
"Epigenomic Correlation" provides details into the correlation analysis of epigenetic modification signals between two samples. Regions of synteny-conserved lncRNAs were divided into upstream 2 kb, gene body, and downstream 2 kb regions, with each part further divided into 20 subregions. The modification level for each subregion was calculated using CGmaptools or deepTools. Finally, the correlation of epigenetic modification levels between two specified samples was computed using a Python script with the Spearman method.
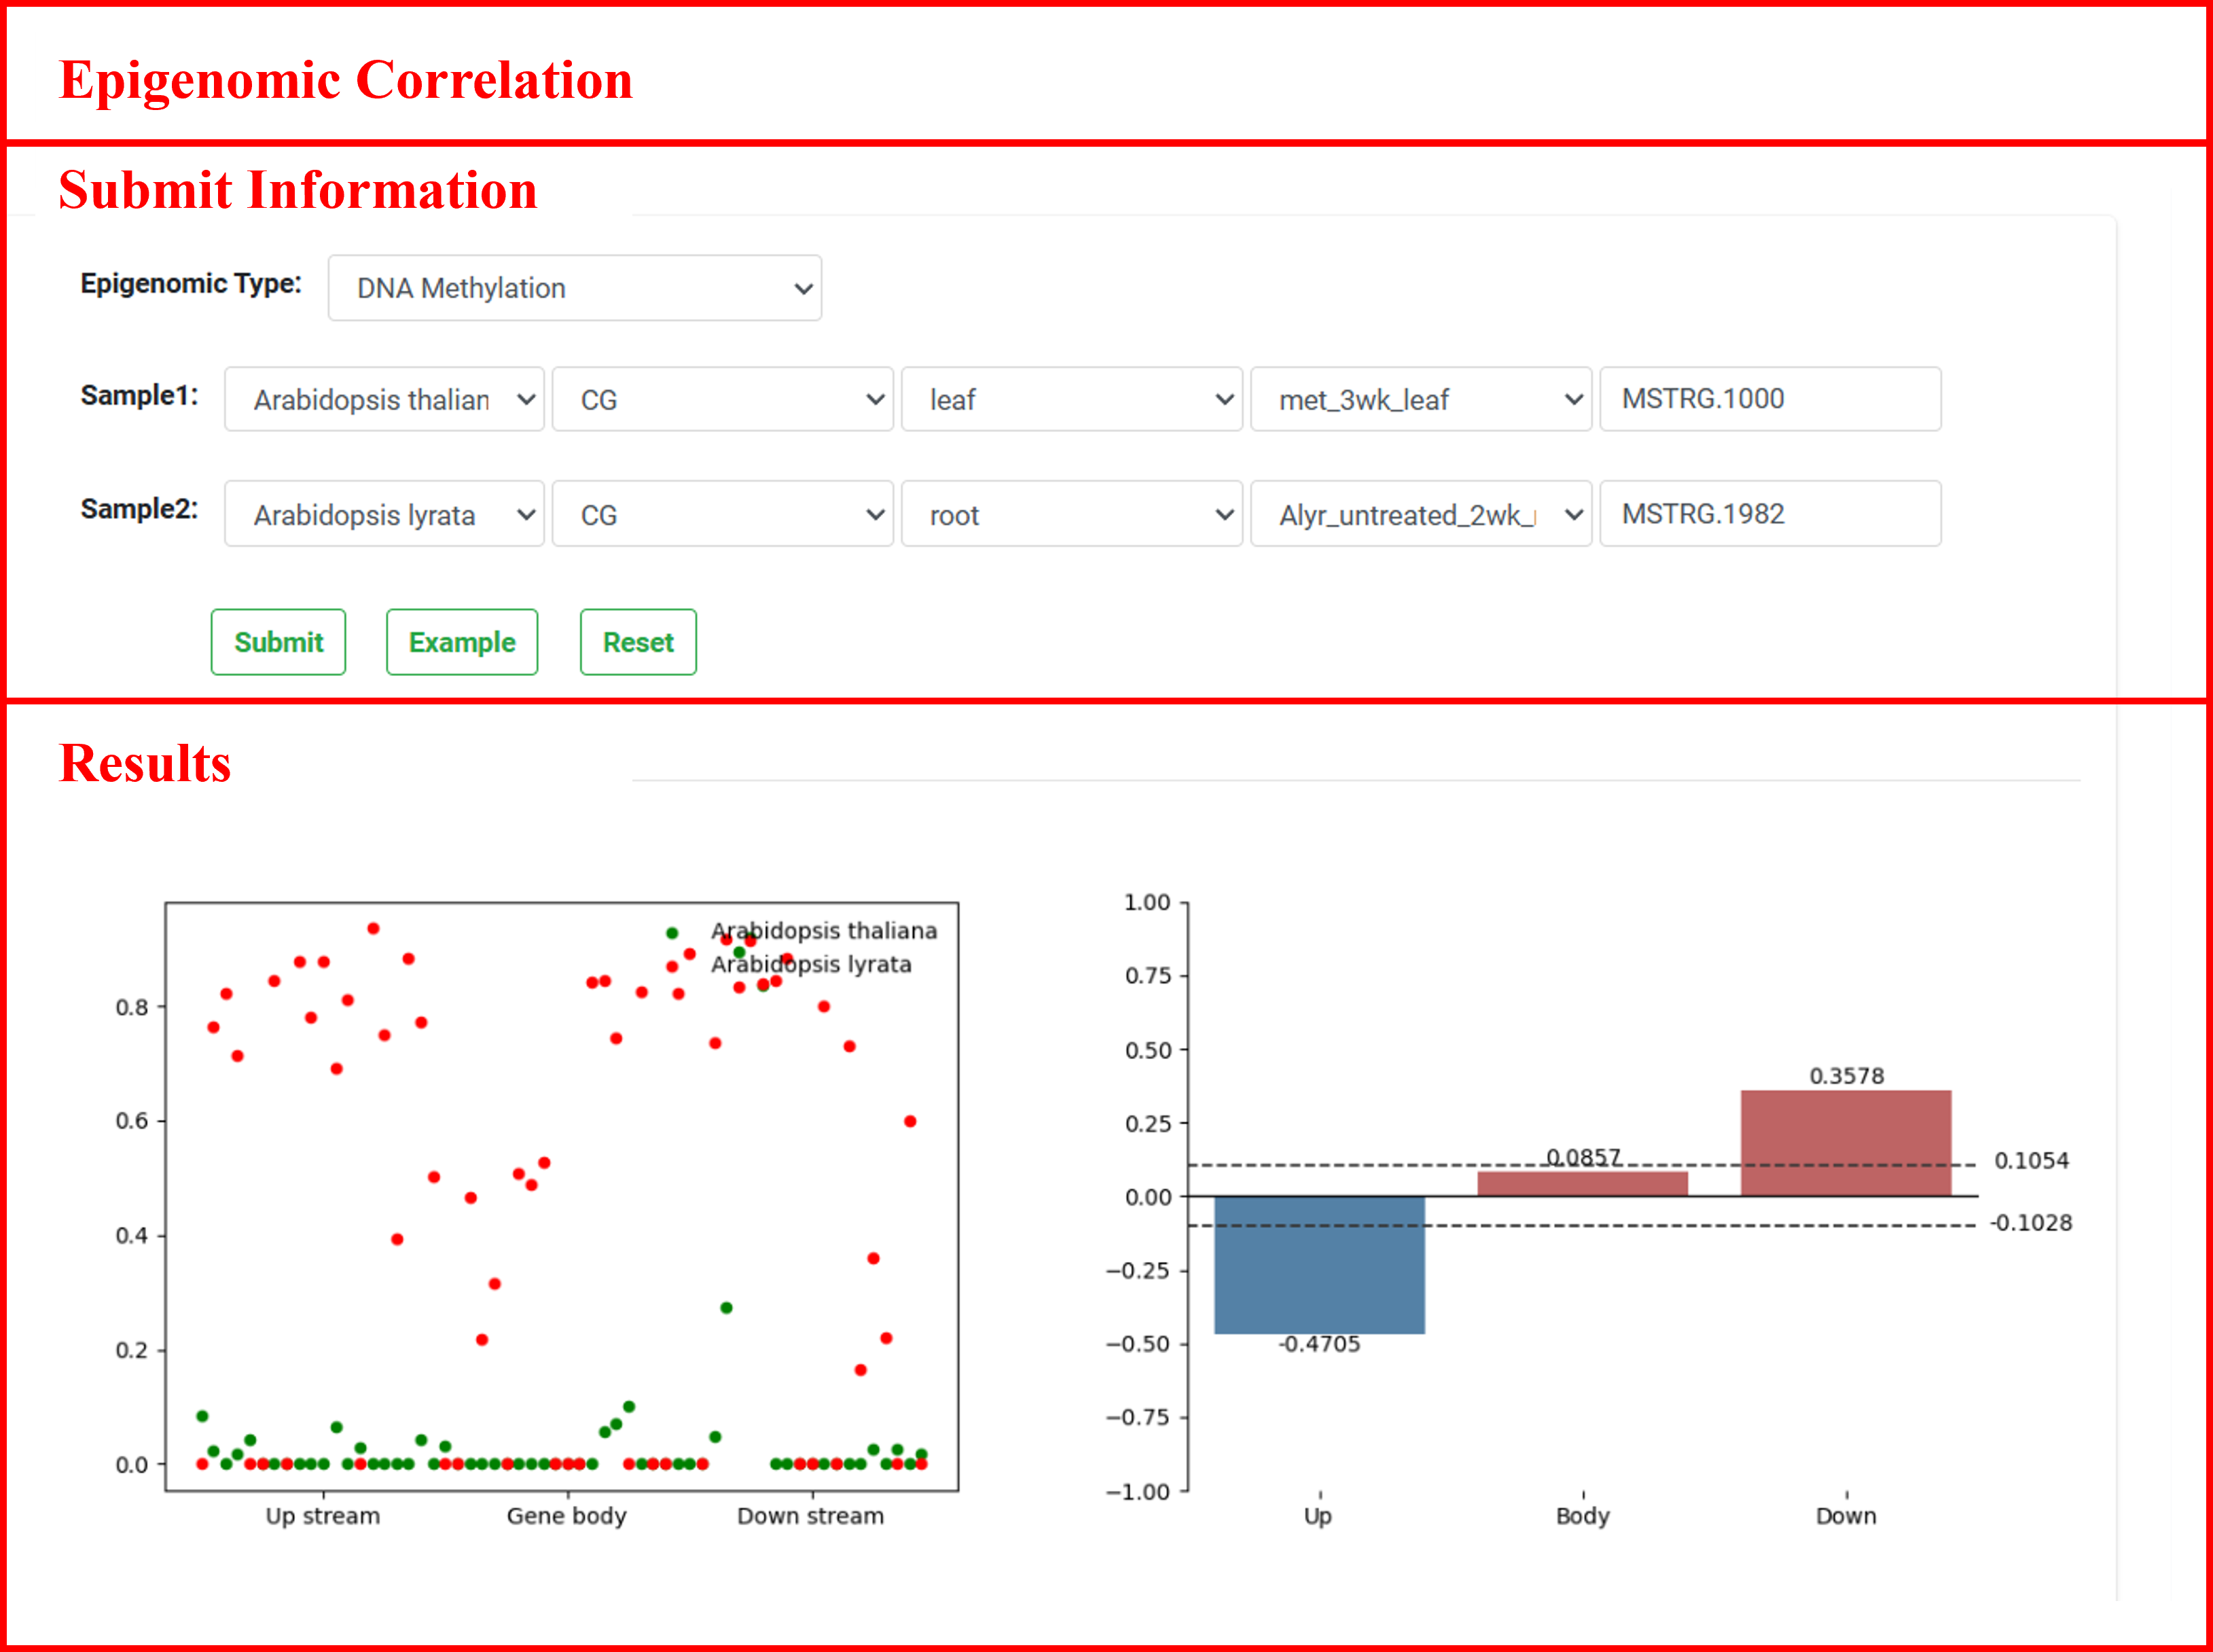
The results include images illustrating the distribution and correlation of epigenetic modification levels for two lncRNAs across upstream, gene body, and downstream regions in specific samples. In the correlation plot, red indicates the degree of positive correlation, while blue represents negative correlation. The dashed line marks the correlation threshold corresponding to a significance level of 0.05. Correlation values exceeding the absolute value of this threshold suggest a more reliable level of correlation in the epigenetic modifications of the two lncRNAs in the given sample.
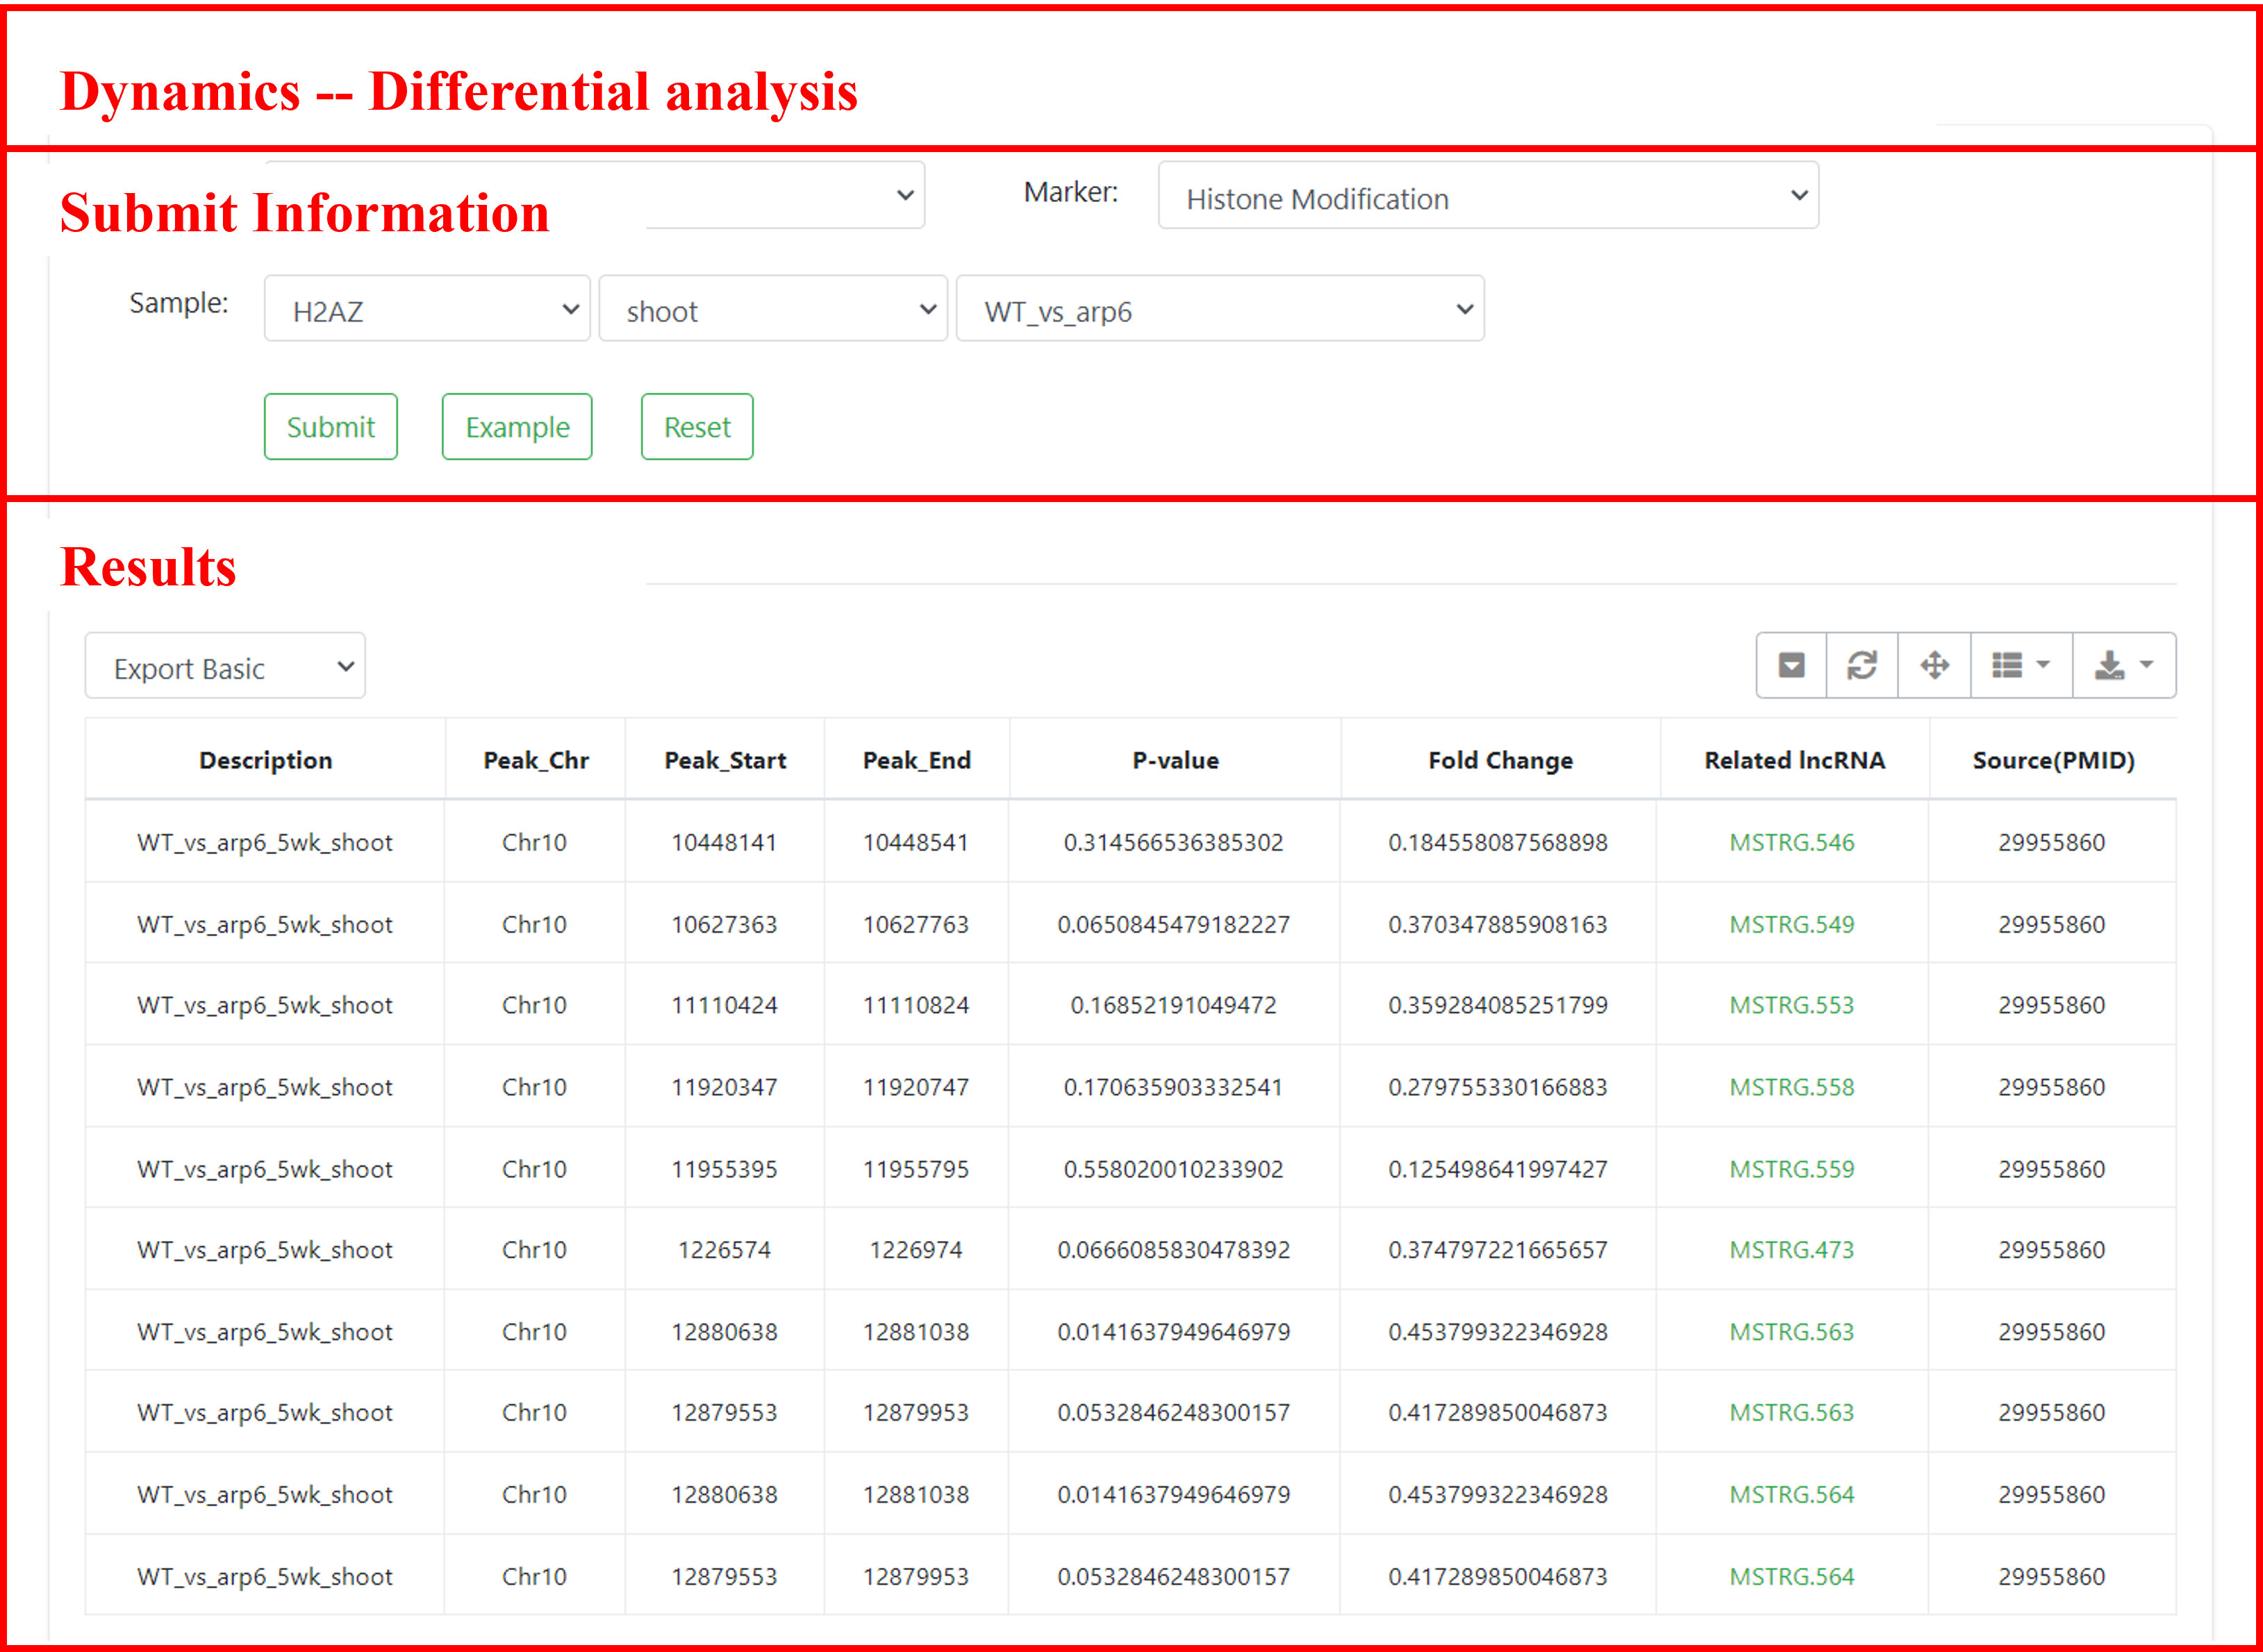
7 Dynamics
In the Dynamics module, differential analysis data for epigenetic modification signals under mutations and stress conditions are provided for approximately 2000 samples. Users can retrieve relevant differential epigenetic regions, differential results, and sample information by selecting the species of interest, modification type, and sample details.
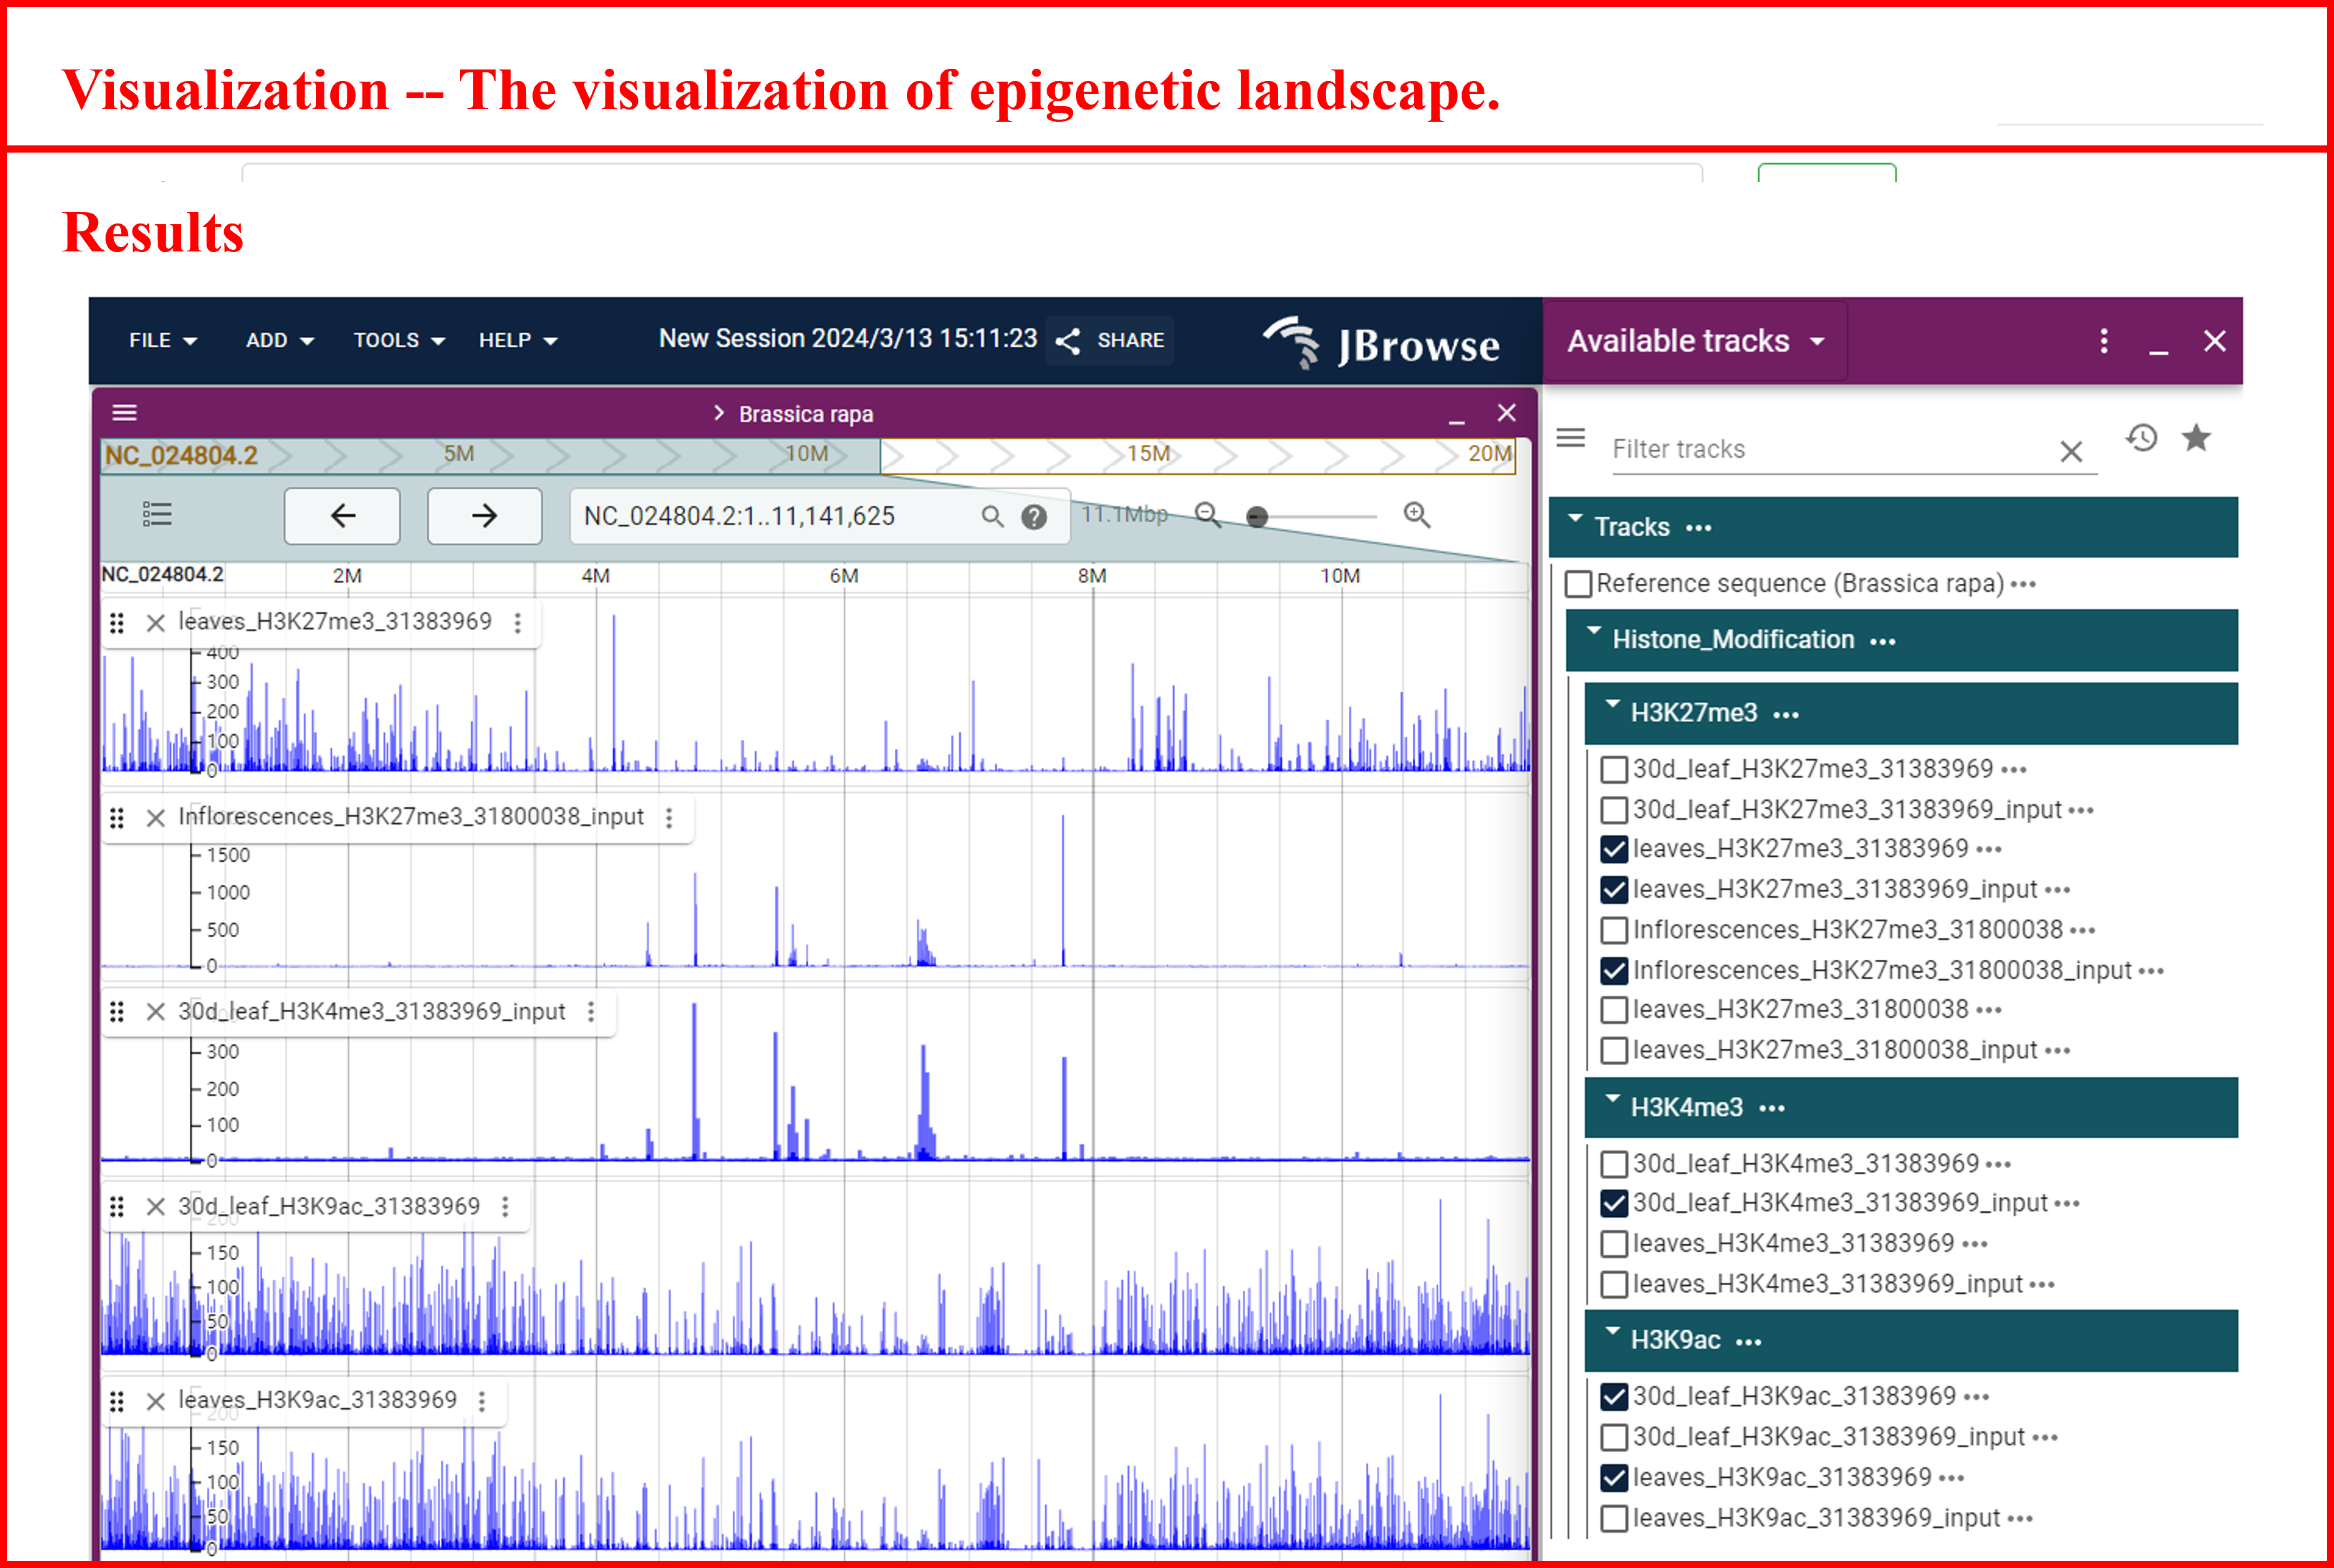
8 Visualization
In the Visualization module, the JBrowse tool is integrated, facilitating the exploration of epigenetic landscapes for species of interest, various types of modifications, and sample data. And also we annotated significant peak positions to improve interpretability.
9 Tools
This module provides sequence alignment information between multiple species and automatic annotation of differential epigenetic regions on specific genomic regions.
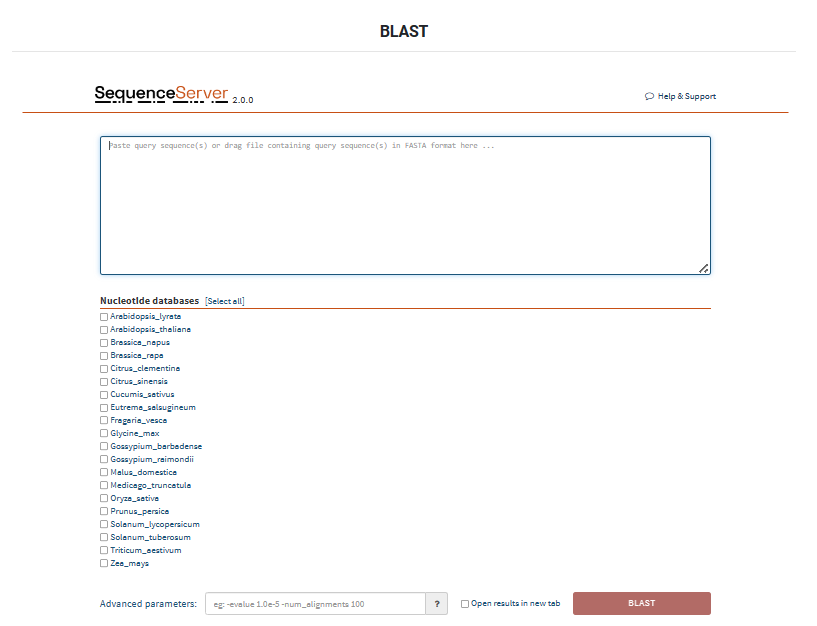
9.1 BLAST
Searching for transcription factor binding sites in specific genomic regions, and finding associated regions and lncRNAs. Users can submit the species of interest, transcription factor type, and genomic region to retrieve information about relevant regions, including sample descriptions, locations, associated lncRNAs, sample sources, and more. Additionally, users can navigate to the detailed page of the gene by clicking on the lncRNA ID.
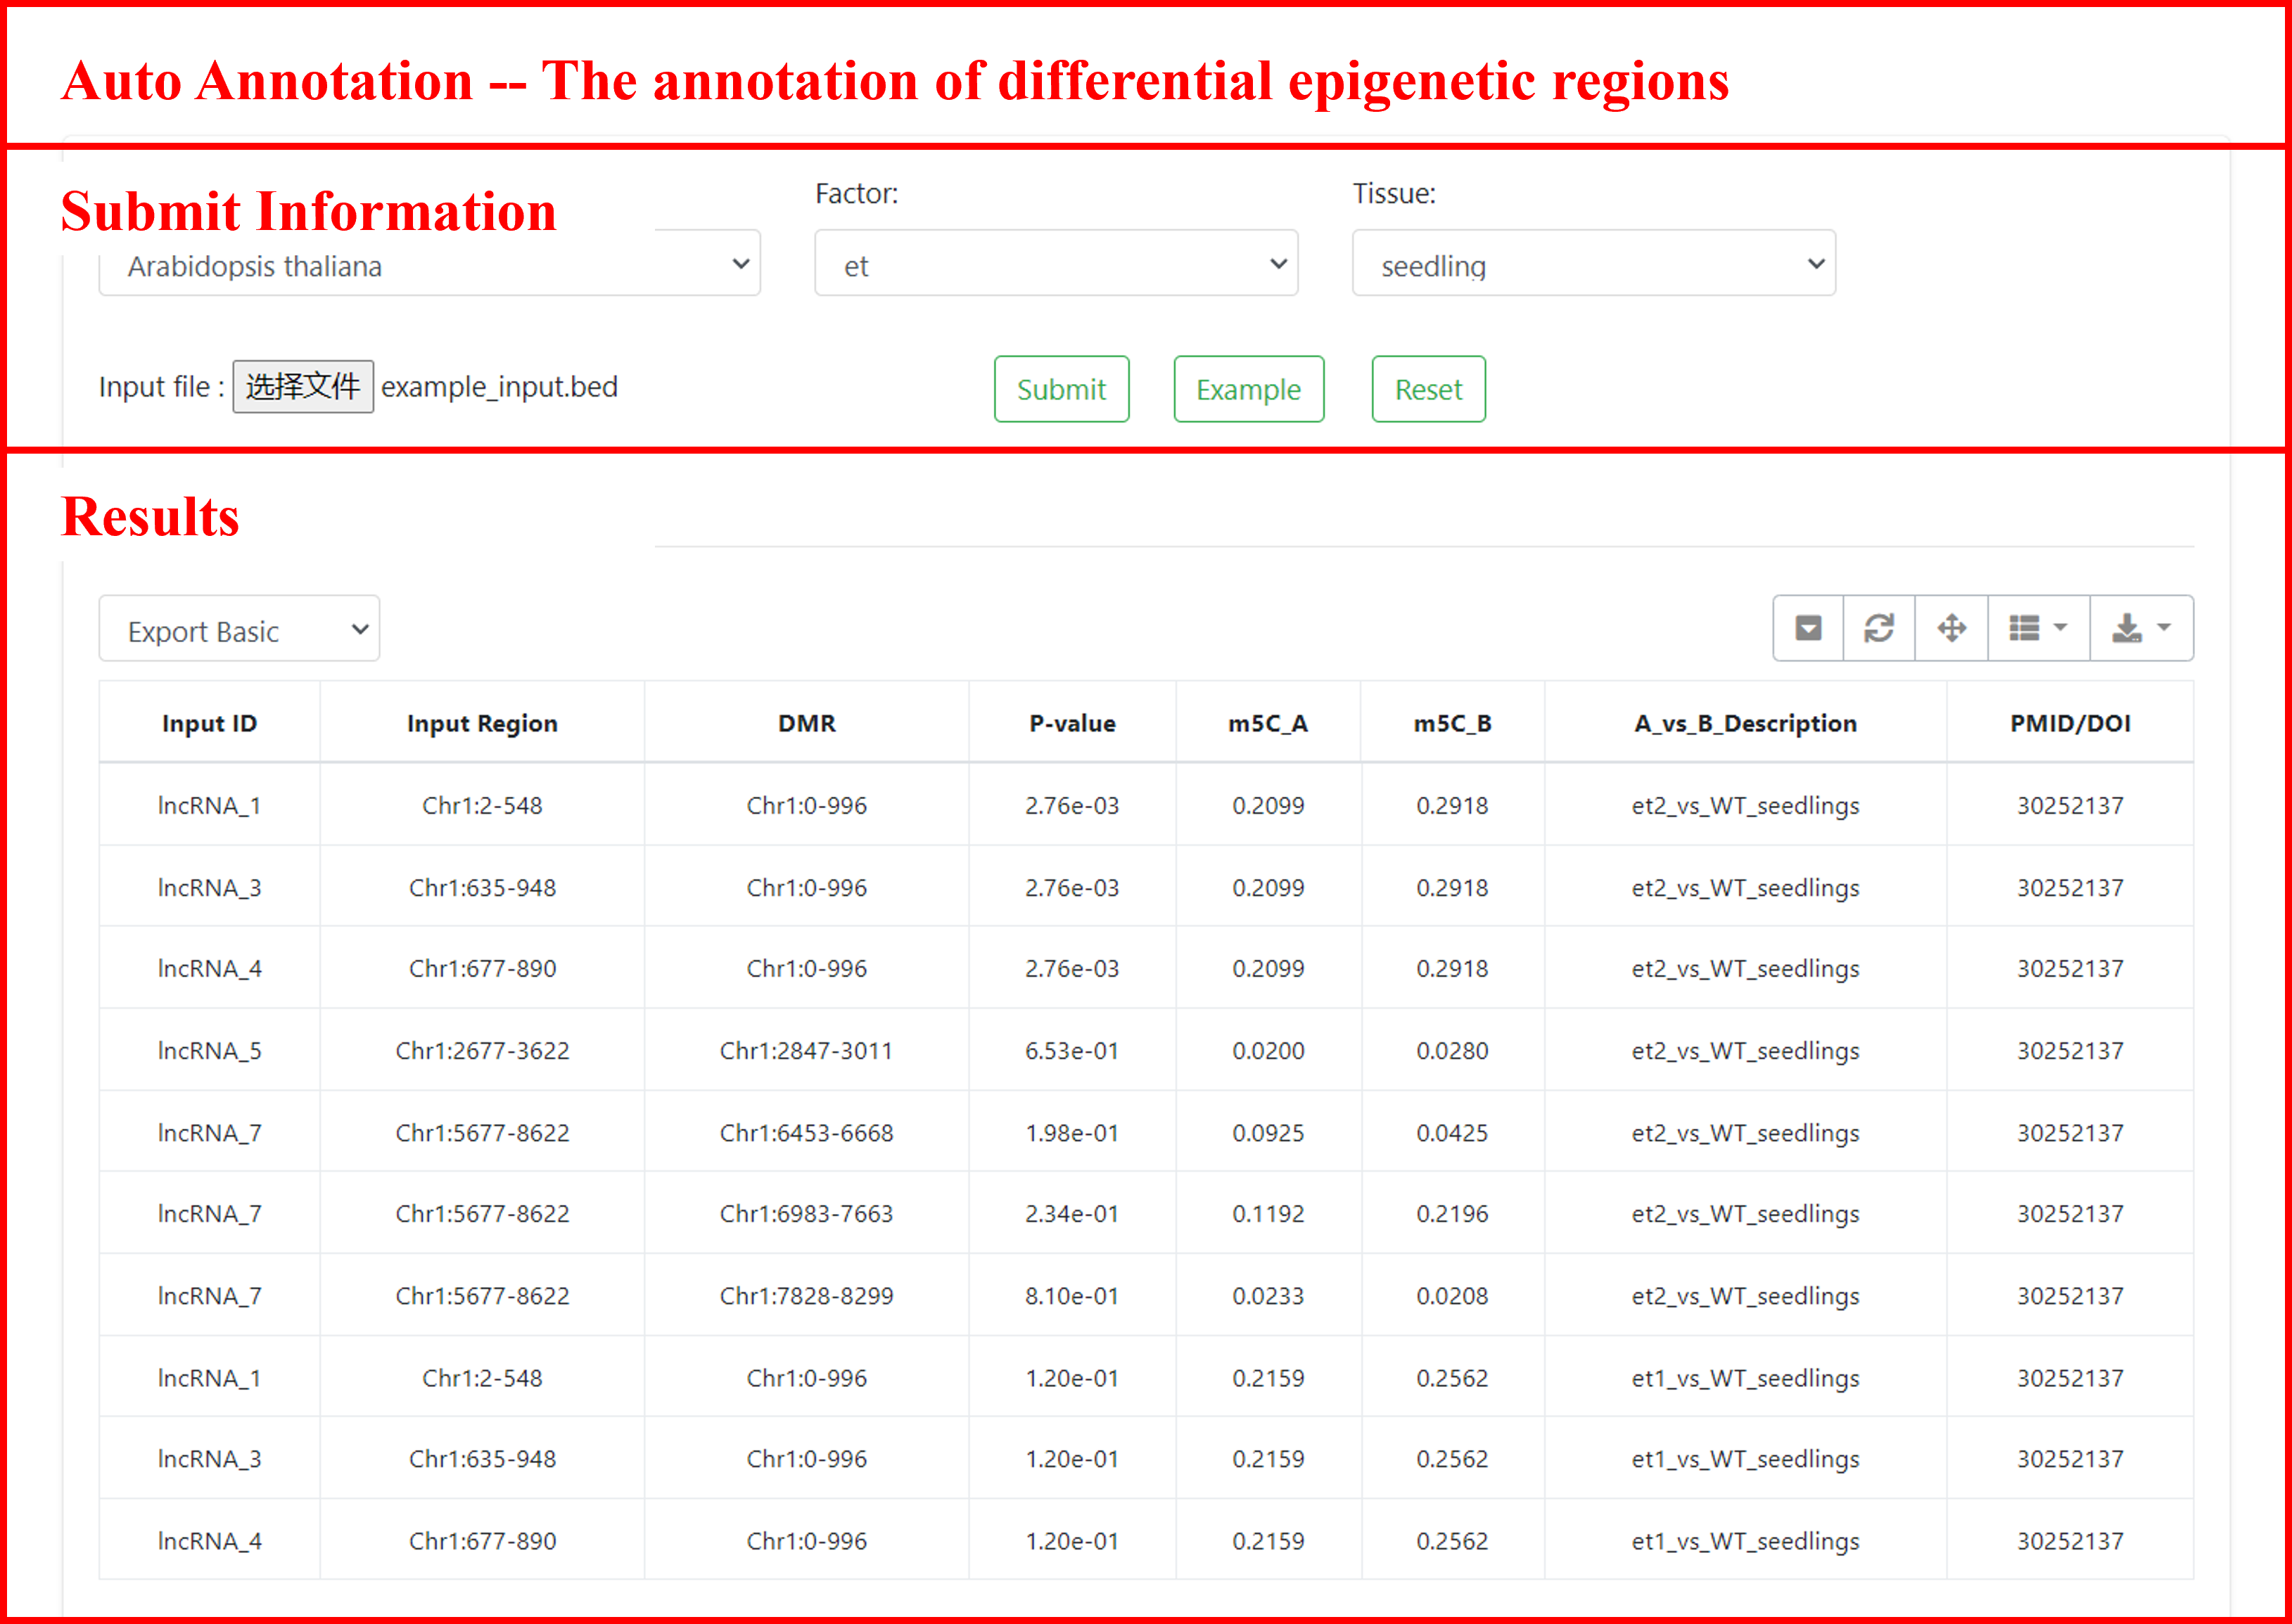
9.2 Auto Annotation
This study employed the "dmr" analysis strategy of CGmapTools software to systematically accomplish the following key steps: (1) detection and localization of differentially methylated regions (DMRs); (2) precise calculation of average methylation levels in each region, thereby accurately identifying genomic regions with significant methylation changes across different samples or experimental conditions.
For ChIP-seq data analysis, we integrated both DiffBind and DESeq2 methods for statistical significance analysis. By applying stringent thresholds for fold change and p-values, we reliably identified biologically significant differential binding peaks.
This module, we provide all differential epigenetic modification regions to exploring the dynamics informations in specific genomic regions by yourself. Based on the genomic coordinate files (BED format) provided by users, this study employed bedtools for efficient genomic interval operations and utilized the ChIPseeker package to achieve precise annotation and localization of differentially modified epigenetic regions with long non-coding RNAs (lncRNAs). You can retrieve information on interesting genomic regions associated with epigenomics.